Download
1 / 125
1.27k likes | 1.46k Views
STATISTICAL HYPOTHESIS TESTING BY Dr. K.R. SUNDARAM Professor & Head Department of Biostatistics All India Institute of Medical Sciences New Delhi-110029 Workshop on “Essentials of Epidemiology and Research Methods” October 8-12 , 2003, Surajkund,Faridabad.

E N D
STATISTICAL HYPOTHESIS TESTING BY Dr. K.R. SUNDARAM Professor & Head Department of Biostatistics All India Institute of Medical Sciences New Delhi-110029 Workshop on “Essentials of Epidemiology and Research Methods” October 8-12 , 2003, Surajkund,Faridabad
STATISTICAL METHODS • Descriptive methods • Inference methods
(A) Descriptive Methods :-- Statistical methods used for describing ( summarizing ) the collected data:--- Statistical Tables, Diagrams & Graphs, Computation of Averages, Location Parameters, Proportions & Percentages, Deviation measures and Correlation measures and Regression analysis .
(B) Inference Methods:-- Statistical methods used for making inferences (generalizations) from the results obtained from the sample to the population from where the sample was selected
Two important questions raised in scientific studies • How reliable are the results obtained----ESTIMATION (B) How probable is it that the differences between observed & expected results on the basis of the hypothesis have been produced by chance alone TEST OF STATISTICAL SIGNIFICANCE :---by computing the chance element
Important terms / concepts concerned with the Statistical Inference :-- Standard Error Confidence Interval Null Hypothesis Alternate Hypothesis Type-I error ( level of significance / ‘p’ value’/ ‘’value ) Type – II () error Probability and Probability distributions or Statistical distributions ( Normal , Binomial, Poisson etc. ) Test Statistic ( Test Criterion ) Critical Ratio and Decision making .
Notations used :-- StatisticalPopulationSample figure Number of N n subjects Value of observation - X Mean M ( ) m (X ) Proportion P p Standard s deviation Variance 2 s2 Correlation r coefficient
Concept Of Standard Error (SE) Standard Deviation (SD): average amount of deviation of different sample values from the mean value. SD = SQRT ( (X-m)2/n ) X – sample value n - sample size m – Mean value in the sample
Standard Error (SE) :--- Average amount of deviation of different sample mean values from the population ( true ) mean value. SE =SQRT ((m-)2/r) ( = Grand ( combined ) mean = estimate of population mean , r - no of samples)
Computation of SEusing the above formula is difficult and may not be feasible. Hence, SE is usually computed from one randomly selected sample of adequate size, as follows:- SE = SD / SQRT(n)
Probability :--Relative frequency or probable chances of occurrences with which an event is expected to occur on an average –in the long run. :--Relative frequency of the number of occurrences of a favorable event to the total number of occurrences of all possible events. No conclusion can be drawn with 100 % certainty ( confidence ) Probability is the measurement of chance / uncertainty / subjectivity associated with a conclusion.
Two Types of Probability:- ( A )Mathematical ( B ) Statistical
(A) Mathematical probability: An experiment or a trial where the probabilities of occurrences of various events / possibilities are already established mathematically. • Examples:--- • (1) Prob. of getting a head when a coin is • tossed • Prob. of getting five when a dice is • thrown • Prob. of getting spade ace from a deck of • cards
(B)Statistical / Empirical Probability: An experiment or a trial is required to find out the probabilities of occurrences of various events / possibilities. Examples :---- (1 ) Prob. of getting a boy in the first pregnancy (2 ) Prob. of getting a twin for a couple. (3 ) Prob. of improvement after the treatment for a specified period (4 ) Prob. of getting lung cancer in smokers (5 ) Prob. of an association of sedentary type of work with diabetes (6 ) Prob. that drug-A is better than drug-B in curing a disease.
Probability Distributions Several basic theorems based on which several types of probabilities are computed. A series of probabilities associated with various occurrences/ outcomes/ possibilities of events in an experiment/ trial/ study will generate a probability distribution. Basically -three types of probability distributions: Binomial , Poisson and Normal distribution.
Probability Distributions Binomial and poisson distributions --for discrete variables Normal distribution --for continuous variables . Most important probability distribution in statistical inference is Normal distribution(Guassian distribution ) Normal distribution will generate a Normal (Guassian ) curve .
Properties of Normal Curve: (1 ) It is bell shaped & symmetrical (2 )The three types of averages--- the mean,the median & the mode will be almost equal (3 ) The total area under the normal curve will be equal to “1” (4) Fifty percent of the sample values will lie on the left of the perpendicular drawn on the middle and the remaining 50 % will lie on the right of this line
Properties of Normal Curve: (5 ) Mean - 1 SD & mean + 1 SD will include about 68 % of the sample values (6 ) Mean – 2 SD& Mean + 2 SD will include about 95 % of the sample values (7 ) Mean – 3 SD & mean + 3 SD will include about 99 % of the sample values
Properties of Normal Curve (8 ) Theoretically the curve touches the horizontal line only at the infinity (9 ) (Sample value – Mean ) / SD which is called as Standard Normal Deviate / Z- score is distributed with a mean of “ 0 “ and a SD of “ 1 “ , what ever the variable may be . This is a very important property.Inference theory is based on this property.
Estimation of Population Parameters Two types of Estimation (1)Point estimation – (Estimation without Confidence) Values of mean, proportion,correlation coefficient etc. computed from sample serve as estimates of the population parameters. This estimate is a single value and is calledPoint estimate.
(2) Interval estimation: (Estimation with Confidence) A lower limit (LL) and an upper limit (UL) are computed from sample values It can be said with a certain amount of confidence, that the population value (true value) of the parameter will lie within these limits. These limits are calledConfidence limits or Interval estimates.
The LL and UL estimates for the Population mean are given as :- mean - C* SE and mean + C*SE C= Confidence coefficient, SE ={ SD / (n) }, n = sample size. ( * = multiplicative sign ) If 95% confidence is desired , C = 1.96 , for 99% confidence, C = 2.58 for 99.9% confidence, C = 3.29
Example-1: In a study of a sample of 100 subjects it was found that the mean systolic blood pressure was 120mm. of hg. with a standard deviation of 10mm. of hg. Find out 95% confidence limits for the population mean of systolic blood pressure. SE = SD / ( n ) = 10/ ( 100 ) = 10/10 =1 LL :--- mean - 1.96*1 :--- 120 - 1.96 = 118.04 UL :--- mean +1.96*1 :--- 120 + 1.96 = 121.96 i.e. the population mean value of systolic blood pressure will lie between 118.04 and 121.96 and we can have a confidence of 95% for making this statement.
Example-2: (2) In a study of 10,000 persons in a town , it is found that 100 of them are affected by tuberculosis. Find out 99% confidence limits for the population prevalence rate. SE = (( pq)/(n)), where, p= (100/10000 ) * 100 = 1% q = 100 – p = 100 – 1 = 99%, SE= ( (1*99) / 10000 )= 0.0995 LL = p - 2.58*0.0995 = 1- 0.2567 = 0.7433 = 0 .74 % UL= p +2.58*0.0995 = 1 +0.2567 = 1.2567 = 1.26 % i.e. the population prevalence rate of tuberculosis will lie between 0.74% and 1.26% and we can say this with 99% confidence
Statistical Hypothesis A declarative statement about the parameters (of population) or the distribution form of the variable in the population.
Examples • Mean systolic blood pressure (m) in normal subjects of 30 years of age in the population is equal to 120mm i.e. M=120. • 2. Mean cholesterol value in hypertension patients (M1) > mean cholesterol value in normals (M2) i.e. M1>M2. • 3. Percent of babies born with low birth weight to anaemic women (P1) is greater than that in normal women (P2) i.e. P1>P2. • Occurrence of lung cancer is associated with smoking. • 5. Birth weights of children are normally distributed
Null Hypothesis --- Ho No difference in average values or percentages between two or several populations. Examples:--- ( 1 ) Mean cholesterol value in normal (M1) =Mean cholesterol value in hypertension patients ( M2 ) ( 2 ) Percentage of babies born with low birth weight in anaemic women ( P1 ) = Percentage of babies born with low birth weight in normal women ( P2 ) ( 3 ) no association between lung cancer and smoking
Alternative Hypothesis( H1)---two sided There is difference in average values or percentages between two or several populations:--- M1 M2 P1 P2 Alternate Hypothesis (H1 )---one sided M1 > M2 or M2 > M1 P1 > P2 or P2 > P1
Examples:--- ( 1 ) Mean cholesterol value in hypertension patients (M1) > Mean cholesterol value in normals( M2 ) ( 2 ) Percentage of babies born with low birth weight in anaemic women ( P1 ) > Percentage of babies born with low birth weight in normal women ( P2 ) ( 3 ) There is an association between lung cancer and smoking---Prevalence of lung cancer is higher in smokers than in non-smokers
TYPE - I & TYPE- II ERRORS Consider the following 2X2 Table:-- Ho True False Accept(no error) - (type- II ) Reject - (type –I) (no error)
Type- I error :---- : p- value : level of significance probability of rejecting Ho when it is actually true. = probability of finding an effect when actually there is no effect. measures the strength of evidence by indicating the probability that a result at least as extreme as that observed would occur by chance 1-=Confidence coefficient = probability of rejecting Ho when it is false = probability of finding an effect when actually there is an effect.
Type - II error :- = Probability of accepting Ho when it is actually false. = Probability of not finding an effect when actually there is an effect. 1-= Power of the test= Probability of accepting Ho when it is true = Probability of not finding an effect when actually there is no effect.
When the null hypothesis is rejected, type-I error is to be stated Maximum error allowed---5 % i.e., Minimum confidence required---95 % • When the null hypothesis is accepted, type- II error is to be stated Maximum error allowed---20 % i.e; Minimum power required ----80% • When the null hypothesis is rejected at a chosen level of significance ,what ever may be the sample size it may be adequate but, • when the null hypothesis is accepted, the adequacy of the sample size has to be checked before accepting Ho by computing the Power of the test
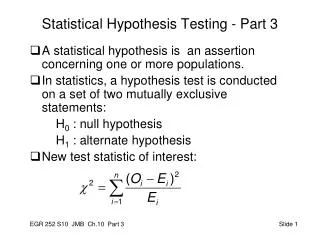
Testing The Statistical Significance Of Hypothesis Testing the statistical significance of Hypothesis is the process of calculations using sample results to see whether the null hypothesis is true or false Steps :--- • State the null hypothesis: H0 • State the alternate hypothesis: H1 (one sided / tailed or two sided / tailed) 3. State the distribution of the sample statistic or the difference(normal or student’s ‘t’ or chi- square). 4. State the level of significance ( or p - value or type -I error) desired.
5. Compute the Test Statistic (TS) = (difference in parameter values) = ------ ----------------------------- (SE of difference) 6. Find out the Critical Ratio (CR) from the statistical table at the chosen level of significance
Take decision :-- a. If TS <CR: accept Ho i.e. difference in parameter values is not statistically significant b. If TS > CR: reject Ho : accept H1 i.e. difference in parameter values is statistically significant . If p < 0.05, Confidence (C) > 95 %; if p < 0.01, C > 99 % and if p < 0.001, C > 99.9%
Guidelines , Steps and Examples in Tests of Significance (A) Continuous variable :- (1) Ho : Null Hypothesis: μ1=μ2 μ1= Mean gain in weight of infants who received supplementary diet μ2= Mean gain in weight of infants who did not receive supplementary diet (2) H1 : Alternate Hypothesis: μ1 μ2
(3-a) If Population distribution of gain in weight in both the groups is NORMAL (either known from earlier studies or could be established from the random samples ) or both the sample sizes are large ( n1 and n2 > 30 ) the TEST STATISTIC is Z and the test is called NORMAL TEST. (3-b) If n1 or n2 or both n1 and n2 < 30 , the TEST STATISTIC is Student`s “t” and the test is called Student`s “t” TEST.
Level of Significance( :-Type I Error:- p-Value ) If = 0.05, Confidence ( C ) = 95% , if = 0.01, C=99 % if = 0.001, C=99.9 %
(5)Test Statistic or Test Criteria (Z) If Normal or n1 , n2 > 30 , • --- ---- where, X1 and X2 are the mean values of weight in Samples A and B respectively and S12and S22 are the corresponding standard deviations.
(6) Critical Ratio ( C.R ) If = 0.05, C.R =1.96 , if = 0.01, C.R.= 2.58 and if = 0.001 ,C.R.= 3.29
(7) Taking DecisionDifference in means between the Two Groups _________________________ If Z < 1.96 Not Significant ( Ho is acceptable ) ( p > 0.05 ) ( a ) Z > 1.96 Significant ( p < 0.05 ) ( b ) Z > 2.58 Highly Significant ( p < 0.01 ) ( c ) Z > 3.29 Very Highly Significant ( p < 0.001 ) ( Ho is rejected in ‘a’ ‘ b’ and ‘c’ )
Various Tests of Statistical Significance (a)To test the statistical significance of the difference in sample and population Means = 0.05 , CR = 1.96 , TC = Z = S / n
Example : Mean SBP in population= 120, Mean SBP in Sample= 115 ( n = 100 SD = 20 ) Z = ( 120 – 115 ) 20 / = 2.5 ie , TC > CR . p < 0.05 Means in the population and sample are significantly different or The sample does not represent the population w.r.t. SBP
( b ) To test the statistical significance of the difference in Mean values between two Populations (1) Large Sample: If Z < 1.96 ,The difference in means in the population and sample can be considered as statistically notsignificant
Test of Homogeneity of Variances ( Fisher`s ‘F ‘ ) • One of the assumption which has to be satisfied for applying Student`s t test is Homogeneity of variances in the two populations .This is tested by computing Fisher`s F statistic. F = for (n1-1) , (n2-1) d.f. ( ) • If the computed F value is less than the Critical ratio of F at (n1-1) , (n2-1) d.f. , then the assumption of Homogeneity of variances in the two populations can be accepted. Otherwise , the variances in the two populations will be Heterogeneous.
(2) Small Samples ( n1 or n2 or both n1 & n2 < 30 ) : (1 = 2) Homogeneity of variances in the two populations is assumed and accepted, where S, Critical ratio values depend upon degree of freedom - ( n1+n2-2 )
3 Small Samples (n < 30 ) and (12) : Homogeneity of variances in the two populations is not accepted, Insuch a case . Modified ‘t’ test has to be applied. If t > t`; p<0.05 (significant) , if t < t` p > 0.05 ( not significant)
Weight ( kg ) of school going ( A ) and non-School going ( B ) children of 5 years of age in slum areas :--- Population Sample Size Mean S.D (1) n1 & n2 > 30 A 100 17.4 3.0 B 100 13.2 2.5 Z = 15.56 ( p < 0.001 ) i.e. ---