Download
1 / 5
50 likes | 144 Views
H I S T O G R A M S. Frequency h istograms and polygons. Same width. Drawing a Frequency histogram and a polygon. 1- Rule up a set of axes on graph paper 2- Title the graph 3- label the horizontal axis and the vertical axis (frequency)

E N D
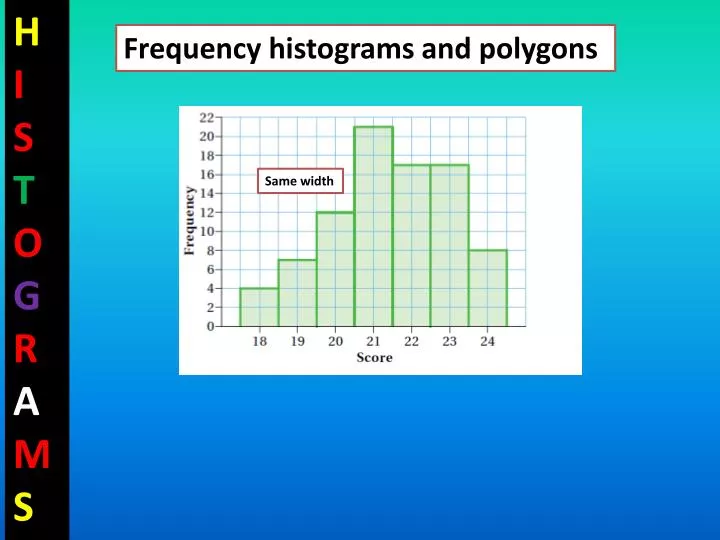
HISTOGRAMS Frequency histograms and polygons Same width
Drawing a Frequency histogram and a polygon 1- Rule up a set of axes on graph paper 2- Title the graph 3- label the horizontal axis and the vertical axis (frequency) 4- leave a ½ unit or interval apace, draw in the first column 5- Draw in the columns for each of the other scores 6- Mark the midpoints of the tops of the columns obtained in the histogram 7- Join the midpoints by straight line intervals Maths Quest 9 5.2 Pathway
A histogram is a graph that uses the height of a column to show the frequency of each score. The scores are always placed on the horizontal axis, and the frequency on the vertical axis. A frequency polygon is a line graph obtained by joining the midpoints of the tops of the columns of a histogram. New Century Maths
1- Rule up a set of axes on graph paper 2- Title the graph 3- label the horizontal axis and the vertical axis (frequency) 4- leave a ½ unit or interval apace, draw in the first column 5- Draw in the columns for each of the other scores 6- Mark the midpoints of the tops of the columns obtained in the histogram 7- Join the midpoints by straight line intervals
Features of a histogram The label for each score is placed under the centre of its column, on the horizontal axis. • No gasps are allowed between columns. Each column must be the same width. A space (equal to half the column width) is left between the vertical (frequency) axis and the first column.