Download
1 / 5
50 likes | 162 Views
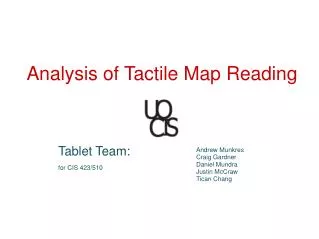
Analysis of Tactile Map Reading. Tablet, Visual and Signal Teams for CIS 423/510. For analysts like Amy Lobben who research how visually-impaired users navigate tactile maps. Provide a tool capable of: tracking finger movements over a tactile map overlay

E N D
Analysis of Tactile Map Reading Tablet, Visual and Signal Teams for CIS 423/510
For analysts like Amy Lobben who research how visually-impaired users navigate tactile maps. Provide a tool capable of: tracking finger movements over a tactile map overlay visualizing the data received during tracking Who is this Tool for and Why?
Overview First Prototype: A foundation for new requirements, design and implementation details Accomplishments: • Established feasibility of tracking multiple fingers with video • Established feasibility of tracking a finger with tablet • Combined video and finger tracking data • Created one example data display (heat map) • began discussion of what kinds of analysis and display methods are useful • Built a "baseline" implementation of all components • allows future teams to pick individual components to enhance or replace
Teams Tablet Team: Tracks a single finger using a tablet and pen device Visual Team: Tracks multiple fingers from a video source Signal Team: Visualizes data received from Visual and Tablet Team into graphs representing finger movements
Presentation Overview Tablet Team Presentation Visual Team Presentation Signal Team Presentation Live Demonstration Questions and Feedback (will follow each presentation) Setup during combined Visual and Tablet Team testing