Download
1 / 42
500 likes | 936 Views
Map Reading. 1 st Class Training Course. Introduction. This lecture is a condensed version of the Map Reading Training course. During this lecture, you will learn about Maps and their language and Scale.

E N D
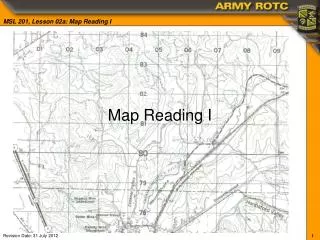
Map Reading 1st Class Training Course
Introduction • This lecture is a condensed version of the Map Reading Training course. During this lecture, you will learn about Maps and their language and Scale. • In part 2 of this lecture you will study Grid References, Relief and Gradients & Inter-visibility.
Agenda • What is a Map • Map Language • Scales • Grids • Relief • Gradients and Intervisibility
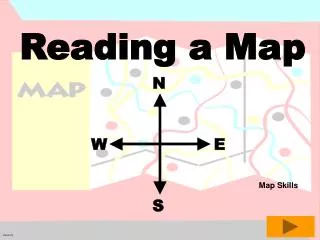
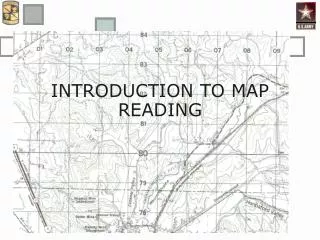
What is a Map? • A Map is abirds eye viewof the surrounding area to help guide us from one place to another. • A travellerneedsa map to help them find their way around more easily.
Lines of Longitude • Lines ofLongituderun parallel to the Prime Meridian at Greenwich A line of Longitude is also referred to as a Meridian
Lines of Latitude • Lines of Latitude run parallel to the Equator
Recording your Position • Lines of Latitude & Longitude come together to form amatrix 1.5
Recording your Position • First we state its Latitude followed by its Longitude in degrees & minutes e.g.: A= 20’N 56’W B= 17’S 17’W C= 45’N 15’E 1.5
Although this system can give reasonably accurate positioning it is not accurate enough for everyday use. • So each degree is further broken down into 60 minutes.
Topographical Maps The M726 series are classed as topographical maps. This means they show theshapeandsurface detailof the land. This includesnaturalandman-madefeatures.
Get the latest edition Roads will be built Rivers could become dams New Buildings could be built OS maps are constantly being updated. It is always advisable to have the most up-to-date map available as some features will change. Some features such as mountainous areas may stay fairly constant
Looking after your map • Always keep your mapfolded • NEVERmark a map surface withink • If you do need to mark your map do so lightly with apencil • Try to avoid getting itwet • If you do get it wet allow it to dry naturally. Some maps are now produced laminated and you can treat maps with a waterproof coating
Folding your map 1.9 First fold your map in half length wise, with the printed map outwards like so:
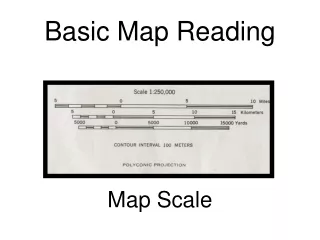
Remember: The M726 series is a 1:50,000 scale map The unit of height used on this map is inMETRES.
Latitude / Longitude Thelines of latitudeare expressed in degrees and minutes and are marked along theright and left(east and west) hand side of the map (key position 15). The lines of longitude are marked along the top and bottom (north and south) of the map in key position 3. The lines of latitude and longitude are not actually drawn on the map itself - it would be too confusing.
North In map reading there are always references to north. There are in fact 3 north's: True North Grid North Magnetic north
True North This is the geographical north pole of the earth - the point where the earth’s axis meet the surface.
Grid North • Because Grid lines are drawn on aflat mapand lines oflatitude & longitudeare curvedlike the the earth's surface. The2 systems are different. • This difference is shown on the map (key position 10) as a difference between True & Grid north. This north takes its name from theNational Grid System. This is a system of imaginary lines drawn vertically & horizontally on the map which divide it into a series of squares.
Magnetic North This is the point the magnetic needlealigns itself to when freely suspended. The earth has its own magnetic field. Unfortunately the earth’snorth and southpoles do not line up with thegeographicalpoles - in fact they are about 1200 miles apart!!
Sometimes the same symbol is shown in different colours to signify a difference example: RedNational Trust symbols show the area is open all year. The same symbol in blue indicates it has a restricted opening period.
50 Contour Lines A contour line is a reddish brown line drawn on the map joining all points of equal height abovemean sea level(MSL) Mean sea level is a fixed height approximately half way between high and low tides calculated atNewlyn in Cornwall over many years. By joining all the points at the same height you can achieve a picture and shape of the land.
These contour lines will wonder all over the map and will eventually rejoin at the start point to show an area of equal height. The only exception to this rule is where a contour line meets a cliff face.
The height is shown in small breaks in the contour line. Every 5th line is shown thicker to make them easier to read. These contour lines are situated at 10 metre intervals on the M726 series. The rise & fall between contours is the Vertical Interval (VI)
Agenda • What is a Map • Map Language • Scales • Grids • Relief • Gradients and Intervisibility
Scales • The objective of this lecture is for you to be able to display an reasonable understanding of size and scale in map work.
Introduction • If your map is to cover a reasonable area then everything on the map has to be reduced considerably from its real size.
Why do we use scale? We use scale so that we can cover a reasonable area of the ground around us and show it on the map.
How do you express scale? There are 3 ways to express scale. These are:
A: In Words • by saying “so many centimetres to the kilometre” Example: a scale of “2cm to 1km” means that for every 2 cm on the map you would travel 1 km on the ground. Measuring the distance from the Squadron headquarters to the local Police Station as 12cm on this scale would be equal to 6km on the ground
B: As a Representative Fraction 1 e.g. In this method the scale is expressed in the form of a fraction. 50,000 Using this method you are saying that any distances measured on the map are one-fiftythousanth of the real distance on the ground.
C: As a Ratio 1:50,000 This is very similar to B, but is written as: this means the same as: 1 50,000
Calculation So a 1:50,000 ratio would be equally valid for: In the case of RF and ratio the expression of distance, whether it’s inches, centimetres or metres, is the measurement on the ground • 1 inch on the map = 50,000 inches on the ground • 1 cm on the map = 50,000 cm on the ground • 1 m on the map = 50,000 m on the ground
If the scale is expressed in words it may be necessary to convert it into either aRFor aratio.
For example: to convert a scale of 1 inch to 1 mile, you have to calculate the number of inches in a mile: • There are 1,760 yards in a mile • There are 5,280 feet in a mile (1760 x 3) • There are 63,360 inches in a mile (5280 x 12)
So the scale of 1 inch to 1 mile can be expressed as a ratio of 1:63,360. This type of calculation is made easier using the metric system, but it will still require careful thought.
Area When using scales, areas of ground will also be proportionatelyreducedbut remember that areas contract rapidly on small scale maps.
For example if you take a map that is half the scale of another, then the area is reduced by aquarter(not a half). This is because the area of a rectangular figure is length multiplied by breadth. If you therefore halved the scale you will quarter the area of the map. 2 4 e.g. 2 4 4 x 4 = 16 2 x 2 = 4
1 km square at 1:12,500 1 km square at 1:25,000 The same area of ground in three different scales (Half the scale = one quarter of the area) 1 km square at 1:50,000
Examples of different scales: • Large scale - city or town maps (defined buildings) • Medium scale - Larger areas (buildings as symbols) • Small scale - atlas (large towns in name only)