Download
1 / 107
1.12k likes | 1.39k Views
Statistics Review – Part I. Topics Z-values Confidence Intervals Hypothesis Testing Paired Tests T-tests F-tests. Statistics References. References used in class slides: Sullivan III, Michael. Statistics: Informed Decisions Using Data , Pearson Education, 2004.

E N D
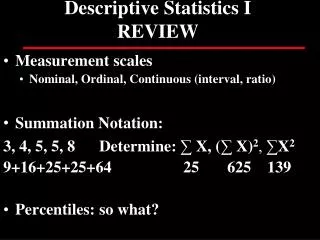
Statistics Review – Part I Topics • Z-values • Confidence Intervals • Hypothesis Testing • Paired Tests • T-tests • F-tests
Statistics References References used in class slides: • Sullivan III, Michael. Statistics: Informed Decisions Using Data, Pearson Education, 2004. • Gitlow, et. al Six Sigma for Green Belts and Champions, Prentice Hall, 2004.
Sampling and the Normal Distribution Relative frequency histograms that are symmetric and bell-shaped are said to have the shape of a normal curve.
Sampling and the Normal Distribution If a continuous random variable is normally distributed or has a normal probability distribution, then a relative frequency histogram of the random variable has the shape of a normal curve (bell-shaped and symmetric).
Sampling and the Normal Distribution • Suppose that the mean normal sugar level in the population is 0=9.7mmol/L with std. dev. =2.0mmol/L - you want to see whether diabetics have increased blood sugar level • Sample n=64 individuals with diabetes mean is 0=13.7mmol/L with std. dev. =2.0mmol/L • How do you compare these values? • Standardize!
Sampling and the Normal Distribution Reading z-scores
Sampling and the Normal Distribution • Standardization: • Using Z-tables to evaluate sample means • Puts samples on the same scale • Subtract mean and divide by standard deviation
Sampling and the Normal Distribution • Why do we standardize? • Enables the comparison of populations/ samples using a standardized set of values • Recall
Sampling and the Normal Distribution The table gives the area under the standard normal curve for values to the left of a specified Z-score, zo, as shown in the figure.
Sampling and the Normal Distribution • Population Mean=10, Standard Deviation=5 • What is the likelihood of a sample (n=16) having a mean greater than 12 (standard deviation = 5)? • What is the likelihood of a sample (n=16) having a mean of less than 8 (standard deviation = 5)?
Sampling and the Normal Distribution Notation for the Probability of a Standard Normal Random Variable: P(a < Z < b) represents the probability a standard normal random variable is between a and b P(Z > a) represents the probability a standard normal random variable is greater than a. P(Z< a) represents the probability a standard normal random variable is less than a.
Sampling and the Normal Distribution • Before using Z-tables, need to assess whether the data is normally distributed • Different ways • Histogram • Probability plot
Sampling and the Normal Distribution Normal Probability Plots:
Sampling and the Normal Distribution Normal Probability Plots: Fat pencil test to detect normality
Sampling and the Normal Distribution Shapes of Normal Probability Plots:
Sampling and the Normal Distribution Normal Probability Plots vs Box plots:
Sampling and the Normal Distribution • If distribution of data is “approximately” normally distributed, use Z-tables to determine likelihood of events
Sampling and the Normal Distribution • Can also “flip” Z-scores to determine the ‘highest’ or ‘lowest’ acceptable sample mean
Confidence Intervals • Point estimate: value of a statistic that estimates the value of the parameter. • Confidence interval estimate: interval of numbers along with a probability that the interval contains the unknown parameter. • Level of confidence: a probability that represents the percentage of intervals that will contain if a large number of repeated samples are obtained.
Confidence Intervals • A 95% level if 100 confidence intervals were constructed, each based on a different sample from the same population, we would expect 95 of the intervals to contain the population mean. • The construction of a confidence interval for the population mean depends upon three factors: • The point estimate of the population • The level of confidence • The standard deviation of the sample mean:
Confidence Intervals If a simple random sample from a population is normally distributed or the sample size is large, the distribution of the sample mean will be normal with:
Confidence Intervals 95% of all sample means are in the interval: With a little algebraic manipulation, we can rewrite this inequality and obtain:
Confidence Intervals • Steps to constructing a confidence interval: • Verify normality if n<=30. • Determine /2, x-bar, . • Find z-score for /2. • Calculate upper and lower bound.
Confidence Intervals Histogram for z
Confidence Intervals Histogram for t
Confidence Intervals • Properties of the t Distribution • The t distribution is different for different values of n. • 2. The t distribution is centered at 0 and is symmetric about 0. • 3. The area under the curve is 1. The area under the curve to the right of 0 = the area under the curve to the left of 0 = 1 / 2. • 4. As t increases and decreases without bound, the graph approaches, but never equals, zero. • The area in the tails of the t distribution is a little greater than the area in the tails of the standard normal distribution. This is due to using s as an estimate introducing more variability to the t statistic. • As the sample size n increases, the density of the curve of t approaches the standard normal density curve. The occurs due to the values of s approaching the values of sigma by the law of large numbers.
Confidence Intervals EXAMPLE: Finding t-values Find the t-value such that the area under the t distribution to the right of the t-value is 0.2 assuming 10 degrees of freedom. Hint: find t0.20 with 10 degrees of freedom.
Confidence Intervals EXAMPLE: Finding Chi-Square Values Find the chi-square values that separate the middle 95% of the distribution from the 2.5% in each tail. Assume 18 degrees of freedom.
Confidence Intervals EXAMPLE: Constructing a Confidence Interval about a Population Standard Deviation
Hypothesis Testing Hypothesis testing is a procedure, based on sample evidence and probability, used to test claims regarding a characteristic of one or more populations. Selecting Hypothesis Testing methods – see next slides.
Hypothesis Testing The null hypothesis, denoted Ho (read “H-naught”), is a statement to be tested. The null hypothesis is assumed true until evidence indicates otherwise. In this chapter, it will be a statement regarding the value of a population parameter. The alternative hypothesis, denoted, H1 (read “H-one”), is a claim to be tested. We are trying to find evidence for the alternative hypothesis. In this chapter, it will be a claim regarding the value of a population parameter.
Hypothesis Testing There are three ways to set up the null and alternative hypothesis: 1. Equal versus not equal hypothesis (two-tailed test) Ho: parameter = some value H1: parameter some value 2. Equal versus less than (left-tailed test) Ho: parameter = some value H1: parameter < some value 3. Equal versus greater than (right-tailed test) Ho: parameter = some value H1: parameter > some value
Hypothesis Testing THREE WAYS TO STRUCTURE THE HYPOTHESIS TEST:
Hypothesis Testing • Two-tailed test