Download
1 / 1
10 likes | 125 Views
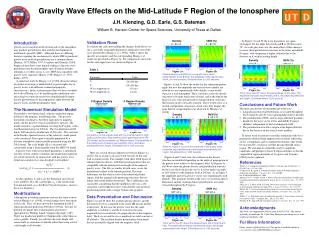
Gravity Wave Effects on the Mid-Latitude F Region of the Ionosphere J.H. Klenzing, G.D. Earle, G.S. Bateman William B. Hanson Center for Space Sciences, University of Texas at Dallas. Density d N/N (%).

E N D
Gravity Wave Effects on the Mid-Latitude F Region of the Ionosphere J.H. Klenzing, G.D. Earle, G.S. Bateman William B. Hanson Center for Space Sciences, University of Texas at Dallas Density dN/N (%) In Figures 5a and 5b the wave parameters are again unchanged, but the angle between k and B at 200 km is now 70o. As in the previous case, the main effect of this change is to create tilted perturbation structures in the lower and middle F region, with steepening at higher altitudes due to the decrease in kz with increasing height. Introduction Gravity waves incident on the bottom-side of the ionosphere may produce perturbations that seed the development of midlatitude spread F (MSF). Although there are differing theories regarding the mechanism by which MSF is produced, gravity wave-induced perturbations are a common theme [Perkins, 1973; Miller, 1997; Cosgrove and Tsunoda, 2004]. Empirical data show some limited evidence of gravity wave penetration into the thermosphere up to F region altitudes, although as yet there are no in-situ MSF data coincident with gravity wave signatures [Bauer, 1958; Hung et al., 1978; Kelley, 1997]. A numerical study by Huang et al. [1998] showed evidence of plasma structuring at midlatitude F region heights due to gravity waves with different assumed propagation characteristics. In the study presented here we have extended the work of Huang et al. by modifying the simulation code, and using it to study the sensitivity of midlatitude F region density perturbations to the propagation angle between the gravity waves and the geomagnetic field. Validation Runs To validate the code after making the changes listed above, we ran a case study using input parameters identical to one of the cases presented by Huang et al., [1998]. Table 1 shows the specific wave inputs, and the corresponding Huang et al. results are presented in Figure 1a. For comparison, our results for the same input wave are shown in Figure 1b. k • B = 0 k • B = 0 Density dN/N (%) -20o off┴ -20o off┴ Figure 2a. Figure 2b. Plasma density and dN/N for a case with the k-vector perpendicular to the B-field. The amplitude of the gravity wave and kz are held constant. Simulated time is 1200 seconds. Figures 3a and 3b show the results for the same propagation angle, but now the amplitude and vertical wave number are allowed to vary exponentially with altitude, as one would expect in a real atmosphere. These variations cause the density structures to become much more distinct, and in the topside the decrease of kz with altitude leads to banded density structures that become nearly vertically oriented. These results serve as a second, independent consistency check since they display the same kind of steepening that was observed by Huang et al. [1998]. Figure 5a. Figure 5b. The k-vector lies 20o below the perpendicular in this case. The amplitude increases exponentially and kz decreases exponentially with height. Simulated time is 1200 seconds. F Region Density F Region Density Original Code Modified Code H=60 km, I=68o H variable, I=68o • Conclusions and Future Work • The main conclusions of our numerical studies are: • Large plasma density perturbations are created throughout the F region by gravity waves propagating at these altitudes. • The perturbations (dN/N) tend to align with their gradients parallel to the wave vector at low and middle F region altitudes, independent of the local magnetic field. • The perturbation structures steepen at the higher altitudes due to the decrease in the vertical wave number. The Numerical Simulation Model The model is two dimensional, with the simulation region defined as the magnetic meridional plane. The positive horizontal coordinate is therefore equivalent to magnetic north, and the positive vertical coordinate is upward. The model considers a spatial domain covering the F region, with a total horizontal extent of 600 km. The two-dimensional 600 km by 400 km grid is divided into 10,201 cells. The curvature of the Earth is ignored because of the relatively small spatial scale considered. The region is initially populated by a daytime ionospheric density profile generated using the IRI-2001 model. The scale height (H) is calculated self-consistently using a neutral profile from the MSIS-90 model. A gravity wave with user-defined parameters is introduced into this system, and the continuity and momentum equations are solved iteratively in conjunction with the gravity wave dispersion equation for a non-dissipative atmosphere: Density dN/N (%) k • B = 0 k • B = 0 Figure 1a. Figure 1b. Comparison of the original code with the modified version. Both codes use the same initial daytime profile generated by the IRI-2001model, at the coordinates of Wallops Island. The amplitude of the gravity wave increases exponentially, and kz decreases exponentially with height. Simulated time is 1200 seconds. In future work we intend to seed this simulation with wave parameters obtained from empirical observations rather than ad hoc assumptions, and to simulate the densities that would be measured by a rocket or satellite passing through such a region. We also plan to extend this study to nighttime conditions, and perhaps to lower E region altitudes so that the coupled E-F region instability of Cosgrove and Tsunoda [2004] can be explored. Figure 3a. Figure 3b. Same as Figure 2, but now the amplitude of the gravity wave increases exponentially and kz decreases exponentially with height. Simulated time is 1200 seconds. There are several obvious differences between Figures 1a and 1b, but in a large-scale sense both versions of the code lead to similar results. For example, both show tilted layers of enhanced plasma density, with horizontal separations that are compatible with the horizontal wavelength of the imposed gravity wave. The tilts are similar in both cases, as are the undulations evident in the topside gradient. The main differences are the vertical scale of the enhanced plasma region, with the original code producing structures that are longer and extend farther downward. These differences are reasonable, considering that the modified code uses a self-consistent scale height that varies with altitude, and an initial production profile with a steeper bottom-side gradient. Figures 4 and 5 show how the striations in the density structure are modified depending on the angle of propagation of the gravity wave relative to the magnetic field. In Figures 4a and 4b we show the plasma density and perturbation intensity for the case where the gravity wave's k-vector makes an angle of 110o relative to the magnetic field at 200 km. As in Figure 3, the amplitude and vertical wave vector vary exponentially with altitude. This geometry results in the wave vector being almost horizontal, and the resultant density perturbations are nearly vertical throughout the F region. wb2kx2 (w-kxu0x)2 = (1) (kx2 + kz2 + 1/4H2) • References • Bauer, S. J. An apparent ionospheric response to the passage of hurricanes, J. Geophys. Res., 63, 265, 1958. • Cosgrove, R. B., and R. T. Tsunoda, Instability of the E-F coupled nighttime midlatitude ionosphere, J. Geophys. Res., 109, A04305, doi:10.1029/2003JA010243, 2004. • Huang, C-S, G. J. Sofko, and M. C. Kelley, Numerical simulations of midlatitude ionospheric perturbations produced by gravity waves, J. Geophys. Res., 103, 6977, 1998. • Hung, R. J., T. Phan, and R. E. Smith, Observation of gravity waves during the extreme tornado outbreak of 3 April 1974, J. Atmos. Terr. Phys., 40, 831, 1978. • Kelley, M. C., In situ ionospheric observations of severe weather related gravity waves and associated small-scale plasma structure, J. Geophys. Res., 102, 329, 1997. • Miller, C. A., Electrodynamics of midlatitude spread F 2. A new theory of gravity wave electric fields, J. Geophys. Res., 102, 11,533, 1997. • Perkins, F. W., Spread F and ionospheric currents, J. Geophys. Res., 78, 218, 1973. In this equation, kx and kz are the horizontal and vertical wave numbers, H is the scale height, u0x is the zeroth order background wind, wb is the Brunt-Vaisala frequency, and w is the wave frequency. Density dN/N (%) 20o off ┴ 20o off┴ Modifications Although the governing equations used are the same as those used in Huang et al. [1998], several changes have been made to the code. First, we have moved the maximum for the F region production peak from 300 km to 325 km. Second, we perform our model runs using magnetic parameters appropriate for Wallops Island, Virginia (dip angle = 68o). Third, our production profile is Chapman-like, rather than an ad-hoc profile. Finally, we calculate the scale height self-consistently as a function of altitude rather than using a fixed scale height at all altitudes. Data Presentation and Discussion Figures 2a and 2b show the resultant plasma density, and the fluctuation levels as compared to the initial IRI density profile, respectively. In this case the gravity wave has the same amplitude as in Table 1, and the k-vector has the same magnitude but is reoriented to be perpendicular to the magnetic field. The k-vector and the wave amplitude are held constant at all altitudes. The resultant density perturbations form bands that are essentially aligned with the magnetic field. Acknowledgments This work was supported by NASA grant NAG5-10335. The authors gratefully acknowledge Dr. Chao-Song Huang for providing access to his numerical simulation code. Figure 4a. Figure 4b. The k-vector lies 20o above the perpendicular line through the B-field. The amplitude increases exponentially and kz decreases exponentially with height. Simulated time is 1155 seconds. For More Information Please contact jeffk@utdallas.edu. This poster is available online at www.utdallas.edu/~jeffk/CEDAR/poster01.ppt