Download
1 / 18
180 likes | 303 Views
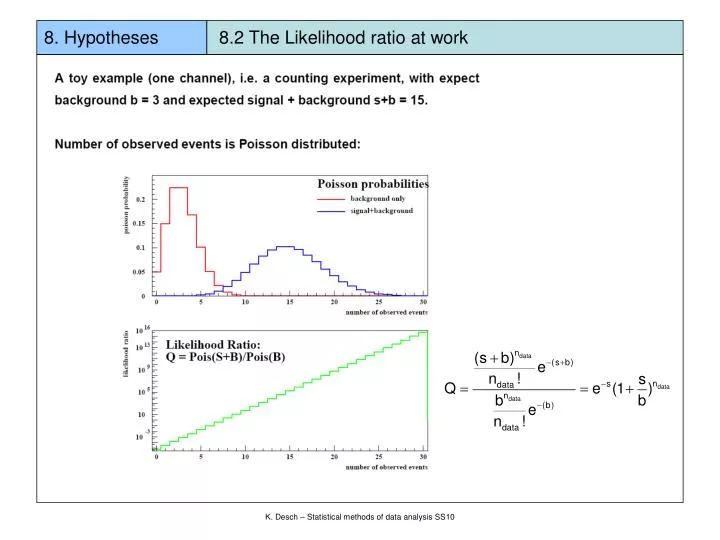
8. Hypotheses 8.2 The Likelihood ratio at work. K. Desch – Statistical methods of data analysis SS10. 8. Hypotheses 8.2 The Likelihood ratio at work. in general, use MC to caluclate the p.d.f. for Q under the s+b and b hypotheses.

E N D
8. Hypotheses 8.2 The Likelihood ratio at work K. Desch – Statistical methods of data analysis SS10
8. Hypotheses 8.2 The Likelihood ratio at work in general, use MC to caluclate the p.d.f. for Q under the s+b and b hypotheses K. Desch – Statistical methods of data analysis SS10
8. Hypotheses 8.2 The Likelihood ratio at work Alex Read, "Modified Frequentist Analysis of Search Results (The CLs Method)" CERN 2000-205 (30 May 2000) http://cdsweb.cern.ch/record/451614/files/open-2000-205.pdf K. Desch – Statistical methods of data analysis SS10
8. Hypotheses 8.2 The Likelihood ratio at work Combination of several channels is easy: For Poissonian p.d.f.s a channel contributes according to ln(1+s/b) to the log LHR! K. Desch – Statistical methods of data analysis SS10
8. Hypotheses 8.2 The Likelihood ratio at work K. Desch – Statistical methods of data analysis SS10
8. Hypotheses 8.2 The Likelihood ratio at work • „Channel“ can mean: • different experiments • different search topologies (event types) in a single experiment • different bins (e.g. reconstructed mass, discr. variable) in the same topology • with different s/b Example: K. Desch – Statistical methods of data analysis SS10
8. Hypotheses 8.3 A real example: Higgs search at LEP In fall 2000 the 4 LEP experiments released their (perliminary) results in the search of the Higgs boson. This was a search of 4 different experiments (detectors) (ALEPH, DELPHI, L3, OPAL) each in 4 different search topologies with small numbers of background and small numbers of expected signal events (in case there was a Higgs boson) No single experiment had enough sensitivity to discover a Higgs at mH >~ 110 GeV Combination was done using the likelihood ratio as a test statistic K. Desch – Statistical methods of data analysis SS10
8. Hypotheses 8.3 A real example: Higgs search at LEP Production: K. Desch – Statistical methods of data analysis SS10
8. Hypotheses 8.3 A real example: Higgs search at LEP Decay: K. Desch – Statistical methods of data analysis SS10
8. Hypotheses 8.3 A real example: Higgs search at LEP Search topologies: K. Desch – Statistical methods of data analysis SS10
8. Hypotheses 8.3 A real example: Higgs search at LEP For each selected candidate event two main discriminating variables were used: b-quark content of the jets (Higgs decays to b-bbar) reconstructed mass of the two jets which are assigned to the Higgs candidate (signal peaks at Higgs mass, background peaks at Z mass) K. Desch – Statistical methods of data analysis SS10
8. Hypotheses 8.3 A real example: Higgs search at LEP For each bin in (mrec, b-tag) the expected s/b was calculated from MC simulation (for a range of hypothetical true Higgs masses) For each hypothetical true Higgs mass („test mass“) a LHR test was performed K. Desch – Statistical methods of data analysis SS10
8. Hypotheses 8.3 A real example: Higgs search at LEP simplest combination throw all eggs in one basket then LHR-Test for 1 channel sensitivity not optimal K. Desch – Statistical methods of data analysis SS10
8. Hypotheses 8.3 A real example: Higgs search at LEP Full LHR test statistic for each experiment (for a single test mass m=114 GeV) full black line: observed -2 lnQ K. Desch – Statistical methods of data analysis SS10
8. Hypotheses 8.3 A real example: Higgs search at LEP Full LHR test statistic for each search topology (for a single test mass m=114 GeV) K. Desch – Statistical methods of data analysis SS10
8. Hypotheses 8.3 A real example: Higgs search at LEP Discovery ? (1- CLb) < Prob(n * ) „100*(1-CLb)“ percent of experiments would yield a test statistic -2lnQ smaller than the observed one, if no signal would be present“ K. Desch – Statistical methods of data analysis SS10
8. Hypotheses 8.3 A real example: Higgs search at LEP Exclusion ? CLs (mtest) < 5% „95% CL exclusion“ „Only 100*CLs percent of experiments would yield a -2lnQ larger (i.e. more BG-like) than the observed one if a signal (at the test mass) would be present K. Desch – Statistical methods of data analysis SS10
8. Hypotheses 8.3 A real example: Higgs search at LEP In the end data were reanalyzed (and some problems were found in the s/b in some bins). Final result less significant (for a signal): K. Desch – Statistical methods of data analysis SS10