Download
1 / 46
460 likes | 725 Views
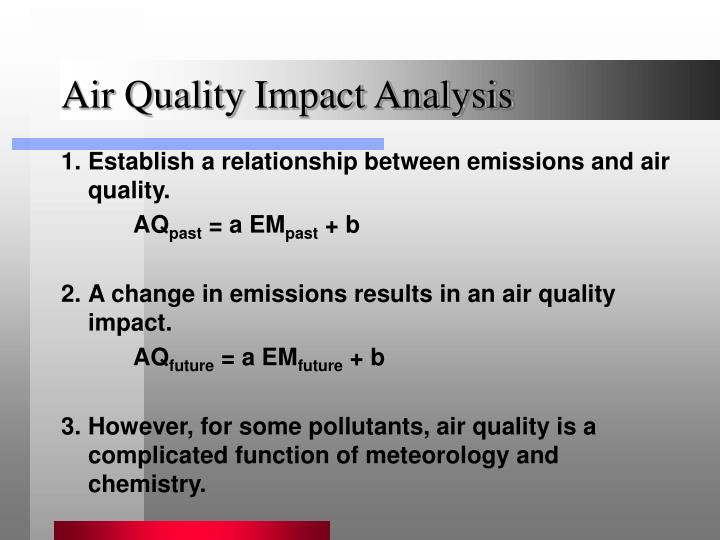
Air Quality Impact Analysis. 1. Establish a relationship between emissions and air quality. AQ past = a EM past + b 2. A change in emissions results in an air quality impact. AQ future = a EM future + b

E N D
Air Quality Impact Analysis 1. Establish a relationship between emissions and air quality. AQpast = a EMpast + b 2. A change in emissions results in an air quality impact. AQfuture = a EMfuture + b 3. However, for some pollutants, air quality is a complicated function of meteorology and chemistry.
Case 1: No Chemistry, Widespread Source • Use Linear Rollback • Pollutants • CO • Diesel particulate matter • Benzene - reacts very slowly
Case 2: No Chemistry, Variety of Sources • Use Chemical Mass Balance Model • Trace metals identify source contributions for organic carbon and elemental carbon • Use Meteorological Analyses • Identify source areas for dust, organic carbon, and elemental carbon
Bakersfield PM Sources 100% 80% Unexplained 60% Nitrate Sulfate Fraction (%) Construction 40% Primary Crude Oil Vegetative Burning 20% Primary MV Geological 0% PM10 PM2.5 PM10 PM2.5 Annual 24-Hour
Case 3: Linear Chemistry, Single Precursor • Verify Linear Rollback • Trace metals identify source contributions • Meteorological analyses identify source areas • Pollutants • Nitrates - correlate to NOX, assume sufficient NH3 • Sulfates - correlate to SOX, assume sufficient oxidant • Secondary organic carbon - estimate with conversion factors for aromatics and high-weight alkanes • 1,3-Butadiene -check for loss rate proportional to O3 • HCHO, CH3CHO - compare to O3 for chemical formation estimate • NO2 - correlate to NOX
Case 4: Complex Chemistry, Several Precursors • PM2.5 • Includes combustion and chemical formation products • PM2.5 nitrates + sulfates + OC + EC + SOC • PM10 • Includes fine and coarse particles • PM10 PM2.5 + dust • Observation-Based Techniques for O3 • Extent of reaction • Ratio of O3 to NOX • NOX concentration
Preparatory Tasks • Data Quality Review • Site visits • Graphical analysis • Statistical analysis • Emission Inventory Reconciliation • Ambient ratio analysis • VOC speciation evaluation
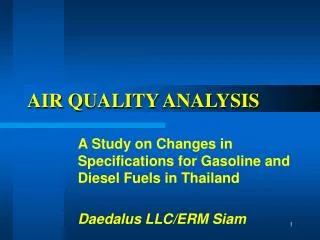
Project Overview A Study on Changes in Specifications for Gasoline and Diesel Fuels in Thailand Daedalus LLC/ERM Siam
Task 4 - Air Quality Analysis • Air Toxics • PM10 and PM2.5 • Ozone • Carbon Monoxide • Nitrogen Dioxide
Task 4 - Air Toxics (Methods) • PTT Data Collection • 3 sites, 40 samples • December 1999 and January 2000 • benzene, 1,3-butadiene • formaldehyde, acetaldehyde • CO, CO2, CH4, TNMHC • Correlate air toxics with CO • Estimate diesel PM from PM10
Task 4 - Air Toxics (Methods) • Calculate 1998 concentrations • PCD 1997-98 CO and PM10 data • Sites with 75% data capture • Estimate 2005 and 2010 levels • Project mobile source NMHC emissions • Project diesel PM10 emissions • Calculate cancer risk • California unit risk factors
Task 4 - Air Toxics (Remaining) • Obtain PCD data • Compare to PTT CO, CH4, and NMHC data as a quality check • Determine if air toxics correlate better with NOX and PM10 • Include secondary formation of aldehydes • Discuss analysis with PTT and PCD • Character of Nonsi site • Resolve 1,3-butadiene issues
Task 4 - PM (Methods) • PCD Data Collection • 16 permanent sites with hourly PM10 data in 1997 and 1998 • Filter-based PM10 and TSP not provided • Summarize 24-hr and annual averages • Examine PM10 relationships with air quality and meteorological data • Estimate 2005 and 2010 levels • Rollback from 1998 using emissions
Task 4 - PM (Results) • Large reduction from 1997 to 1998 • All sites, both averaging times • Annual-average PM ratios • PM10:TSP = 0.3 to 0.6 (4 sites) • PM2.5:PM10 = 0.5 (2 sites) • Din Daeng (54T) is peak site • Strong association with CO and NOX • Weak with NMHC and SO2 • None with O3 and meteorology
Task 4 - PM (Results) • High PM associated with mobile sources, diesel in particular • PM2.5 and PM10 levels exceed all Thai and U.S. standards • Ostro et al. found 10 g/m3 in daily Bangkok PM10 associated with • 1-2% increase in natural mortality • 1-2% increase in cardiovascular mortality • 3-6% increase in respiratory mortality
Task 4 - PM (Results) • PM2.5 and PM10 levels likely to be higher in 2005 and 2010 • Mobile source diesel PM emissions increase • 16% from 1998 to 2005 • 22% from 1998 to 2010 • Mobile source NOX emissions increase • 26% from 1998 to 2005 • 40% from 1998 to 2010
Task 4 - PM (Remaining) • Discuss analysis with PCD • Obtain hi-vol PM10 and TSP data • Compare hi-vol and BAM PM10 data as a quality check • Determine causes of large PM10 reduction from 1997 to 1998 • Compare 1997 air quality and meteorological data to 1998
Task 4 - CO and NO2 (Methods) • PCD Data Collection • 14 permanent sites with CO and NO2 • 1997 and 1998 data most complete • Verify NO2 correlation to CO and NOX • Estimate 2005 and 2010 levels • Rollback from 1998 using emissions • Project mobile source CO and NOX emissions
Task 4 - CO and NO2 (Remaining) • Discuss analysis with PCD • Confirm that no 1998 data from Junkasame (highest CO in 1996) are available
Task 4 -Conclusions • Air Toxics • PTT data provides a good first estimate of gaseous air toxic levels in Bangkok • Diesel PM is the major contributor to cancer risk • Benzene and 1,3-butadiene are also significant contributors • Formaldehyde and acetaldehyde are minor factors, but secondary formation still needs to be included
Task 4 -Conclusions • Particulate Matter • Many days over Thai and U.S. standards for PM2.5 and PM10 • High PM levels related to mobile sources (direct emissions and/or road dust) • PM strongly associated with mortality • Large decrease from 1997 to 1998 may indicate effect of economic crisis
Task 4 -Conclusions • Carbon Monoxide • Likely to attain 1-hour and 8-hour standards with existing controls • Nitrogen Dioxide • Only one violation of standard in 1998 • Peaks driven by mobile source, rather than stationary source, NOX emissions • Peak levels likely to increase in future