Download
1 / 22
220 likes | 394 Views
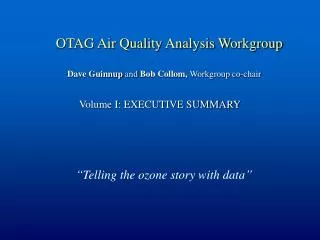
OTAG Air Quality Analysis Workgroup. Telling the OTAG Ozone Story with Data. Dave Guinnup and Bob Collom, Workgroup co-chair. Volume I: EXECUTIVE SUMMARY. Draft, June 2, 1997. Workgroup Objective.

E N D
OTAG Air Quality Analysis Workgroup Telling the OTAG Ozone Story with Data Dave Guinnup and Bob Collom, Workgroup co-chair Volume I: EXECUTIVE SUMMARY Draft, June 2, 1997
Workgroup Objective The Workgroup is to provide assessments of air quality and meteorological data relevant to the mission of OTAG. OTAG mission: To understand the role of transported ozone and precursors in the current ozone nonattainment problem
Description of the Air Quality Analysis WG • AQA WG members were affiliated with EPA, state agencies, industry (power,transportation), consultants, academia • Members were analysts or research managers generally representing their organizations • Interaction occurred through meetings, conference calls (monthly), and e-mail • Sharing of reports, data and comments was conducted through the AQA-WG interactive web site. (http:\\capita.wustl.edu\OTAG\)
Types of Analyses • Spatial pattern percentile analyses • Trajectory residence time analyses • Spatial, temporal correlation analyses • Statistical cluster analyses • Model/data comparisons • Tracer analyses • Temporal pattern and trends analyses • Meta analysis: analysis of analysis • Results integration
Problem Statement • Some nonattainment areas (e.g. NE corridor, Lake Michigan) experience considerable influx of ozone across their boundaries • They cannot demonstrate nonattainment by local measures only • Significant ozone reductions at their boundaries will also be necessary From the OTAG Background Document:
Counties not meeting the 80 ppb standard are more numerous than 120 ppb nonattainments. Transport impacts at 80 ppb are more likely.
Area source NOx emissions are highest near cities.Point sources dominate the center of OTAG. Area Source Density of NOx Point Source Density of NOx
The OTAG domain corners are at tropospheric O3 levels. The highest avg. O3 is over the megalopolis and Ohio Valley.There is an increasing trend from west to east.
Highest (90 %-ile) O3 occurs near urban areas.Lowest (10 %-ile) O3 is high in the center of the domain. 90th percentile of daily max. O3 10th percentile of daily max. O3
Northeast O3 exceedances have been declining.OTAG domain exceedances show less decline. Ten year station-day exceedances for the Northeast. Ten year station-day exceedances for the OTAG domain.
At slow wind speeds, O3 accumulates near source areas.At high wind speeds, O3 is dispersed from sources.The dispersion leads to long range transport and regional O3. Average ozone during low ( < 3 m/s) wind speeds. Average ozone during high (>6 m/s) wind speeds.
In the Northeast, regional O3 is transported mainly through synoptic and channeled flows while local O3is moved by near surface flows.
On high O3 days, the transport winds are slow with clockwise circulation around the south-center of the domain.On low O3 days, the swift transport winds are from outside the domain. Transport winds during high (90%-ile) local ozone days. Transport winds during low (10%-ile) local ozone days.
During regional episodes, air masses meander over the high emission regions and accumulate O3.The ‘88,‘91,‘95 modeling episodes lasted 6-9 days. Ozone pattern and air mass histories during the 1995 episode. Daily maximum ozone averaged over all monitors in the domain.
OTAG-wide episodes tend to be associated with stagnation followed by transport.
The 4 episode avg. model concentration shows high O3 over the central section of the domain.The measured O3 pattern roughly corresponds to the model. Model-average daily maximum O3 during the four episodes. Measured average daily maximum O3 during the four episodes.
The model underpredicts O3 in the North and overpredicts in the South by 10-20 ppb.The modeling periods over-represent O3 in the North and under-represent O3 in the South. Difference between the OTAG domain episodes and the 90th percentile O3. Difference between UAM-V model prediction and measured O3.
Transport winds during the ‘91,‘93,‘95 episodes are representative of regional episodes.OTAG episode transport winds differ from winds at high local O3 levels. Comparison of transport winds during the ‘91, ‘93, ‘95 episodes with winds during regional episodes in general. Comparison of transport winds during the ‘91, ‘93, ‘95 episodes with winds during locally high O3.
OTAG is a well defined control region. Low O3 air comes from outside, high O3 air from inside OTAG. Back trajectory frequencies for low ozone days. Back trajectory frequencies for high ozone days.
The transport winds on high O3 days are slow in the center of the domain.At many sites, the avg. O3 is higher when the wind blows from the center of the domain. Superposition of O3 contours and transport winds during high (90th percentile) O3 conditions. Ozone roses for selected 100 mile size sub-regions.
Emission changes do change O3 levels. 120 ppb exceedances are 3 times higher on Fridays than on Sundays. Map of exceedances on Fridays. Map of exceedances on Sundays.
Conclusions • O3 transport is real, characterized by time and space scales of 150-500 miles • Transport from central portion of OTAG domain more closely associated with high ozone levels downwind • Model may understate transport impacts -- interpret results accordingly