Download
1 / 24
260 likes | 380 Views
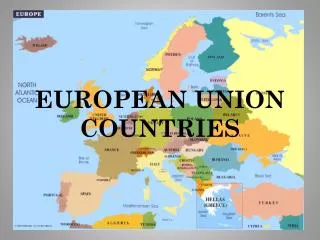
Flanders Waste Management Plan Example for SE European Countries. Dr. S. Helsen Zagreb 25/11/2010. Situation of Flanders. Nort h Belgium Pop. 6 million Area 13.600 km² # Municip . 308. 2. Need for Waste Management Plan. 1970’s poorly managed landfills pollution

E N D
Flanders Waste Management Plan Example for SE European Countries Dr. S. Helsen Zagreb 25/11/2010
Situation of Flanders North Belgium Pop. 6 million Area 13.600 km² # Municip. 308 2
Need for Waste Management Plan • 1970’s poorly managed landfills pollution • 1980’s competences from national to regional level • re-organisation of Assoc. of Municipalities • 1981 waste management and soil remediation competences centralised Public Waste Agency • Flemish Waste Decree based on : prevention, reuse, recycling, incineration, disposal • Five Waste Management (Implementation) Plans since 1986 3
First WMP (1986-1990):Making order out of chaos Closing and redeveloping landfills Maximum use of existing incineration capacity and separate collection of municipal waste Cost depositing at landfill and incineration raised First step towards waste prevention and recovery 4
Second WMP (1991-1995):Built on previous success Necessary policy instruments + infrastructure for segregation at source Separate door-to-door collection of municipal waste streams and recovery Network of recycling yards Infrastructure for collection and processing of VFG and green waste Focused on waste minimisation and recovery 5
Third WMP (1997- 2001):Targets to reduce residual Waste • Partnership with non-profit organisation • Recoverable materials from bulky waste • Prevention /reuse through composting (home/industrial) • Development reuse centres network • Waste prevention public awareness • Incineration: construction postponed, capacity • reduced, optimisation with energy recovery systems • Landfill deposits further reduced 6
Fourth WMP (2003- 2007):Evaluation of Previous Plan • Main goal consolidate results and ensure progress • Implementation, acceleration, intensification of plan • Effective instruments adopted to achieve wide-range • of objectives • Aim: achieving sustainable development and permanent management of materials • Covering entire material chain: production of materials, goods and products to treatment of household waste 7
Fifth WMP (2008- 2015):3 Target objectives • Objective 1 • Environmentally responsible consumption habits • Buy and use environmental friendly products • Government stimulates and sends message to adapt • behavioural consumption to fit new practices • Objective 2 • Reduction of residual waste production without affecting the quantities of materials consumed • Objective 3 • Final waste treatment: BATNEEC 8
Objectives of 5th WMP aim at: Minimum waste produced Re-introduction of waste in material chain recycling Disposal of materials in environmentally friendly way Action programmes: Prevention, lowered consumption and re-use Selective collection and recycling Final treatment 9
Results:Residual waste reduction Targets continuously evaluated and updated Targets achieved faster; e.g. target for 2006: • 3rd WMP 220 kg/head • 4th WMP 160 kg/head Proposed long-term target :150 kg/head 10
Incineration and bio-mechanical pre-treatment of household waste Objective Separate collection WMP 2003 – 2007 • 66 % in 2000 • 69 % in 2008 Objective Cessation landfilling 11
Waste disposal levies vs quantities of landfilled waste 1990-2008 12
Waste-to-Energy CH4 and electricity production, Flemish landfills 1990-2006 13
Discussion • Waste Implementation plans: key to success • Impressive results in reduction, reuse, etc., since 2007 • 70 % of household waste collected separately • less than 3% deposited in landfill • WMP goals achieved • Legislation focus : prevention and recovery of waste • (decrees amended) • WMP targets for 2003-2007 and 2008-2015 • have been met or likely to be met 15
Mix of policy measures • Regulation modifications / adaptations (obligatory) • Voluntary agreements • Market-based instruments • Population communication and initiatives • Agreements, consensus-based policy preferred • Interesting policy outcomes • Population acceptance, willingness to segregate and • compost waste • Waste management and littering high in political agenda 16
Implementation Plan for 5 years - key measure • Comprises provisions for all public authorities • All relevant parties involved in process • Contribution with suggestions • relationship between waste targets and • agreements with municipalities happens naturally • Legal instruments • Uncontrolled landfill and incineration prohibitions • Methodical approach to waste problems • Waste approach based on producer responsibility • (take back obligations) and polluter-pays principle • High landfill tax: incentive to recover & recycle waste 17
Intermunicipal co-operation recommended • Municipalities controlling and financing waste services: • Fixed (yearly) tax & cash tax (Pay-As-You-Throw) • Reduction of residual waste • Development of recycling infrastructure network • (ca. 350 yards), incl. composting activities, etc. • Public Private Partnerships • (contracting, participation, concessions) • Total cost: 220 € / household (2.4 persons) 18
Sorting and recycling natural resources and energy savings • Recycling contributes to saving natural resources : • Aluminium, steel, PET plastic, glass, cardboard,… • Recycling saves energy: • Recycled steel requires up to 85% less energy, etc. • Reducing energy consumption reduces CO2 • In 2008 ca. 680,000 t household waste recycled in BE • 850,000 t of CO2 emissions avoided • Sorting = reflex ! • 95% of Belgians sort their waste • Awareness raising can never stop (schools, firms, ... ) 19
From waste management to sustainable material management • Waste chain managed as one : • from "cradle to grave" or from “cradle to cradle“ • Waste management linked to sustainable material • management (worldwide evolution) • Depletion of resources and environmental pressure • from material reduced • Challenge : providing sustainable material • management policy whilst having a growing economy, • production and consumption on a global scale 20
Waste management: new economic sector • Collecting, sorting • and recycling: • growing economic sector • Recycling sector employs 2,500 people in BE • Waste management offers 8,000 jobs in Flanders • Recycling market stable • Crisis not affected trends in quantity of household packaging put on market 21
Conclusions: 25 years of Waste Management in Flanders Impressive waste management system, one of the best in EU Final disposal in landfills almost ceased / landfill mining! Packaging waste largely recycled or reused Incineration for heat or energy recovery Innovative techniques for better waste treatment Municipalities responsible for implementation of waste policies & organised through intermunicipal cooperations and PPP constructions 22
Setting the example • In Flanders: “There is no such thing as waste” • Export of experience and knowhow to SE European • countries, based on lessons learnt • Advice and technical assistance • Innovation and technologies • Legal instruments • Economical instruments • Social instruments • Challenge: most appropriate instrument or mix of instruments to achieve targets 23
Thank you for the attention ECOREM NV / SA Headquarters: Kontichsesteenweg 38 Keizer Karellaan 292B 16 Place de l’Université B – 2630 Aartselaar Av. Charles Quint 292B B – 1348 Ottignies T +32 3 871 09 00 B – 1083 Brussel/ Bruxelles T +32 10 48 35 03 F +32 3 871 09 01 T +32 2 800 00 10 info@ecorem.be www.ecorem.be Ecorem is a member of the Exequtes Group – www.exequtes.eu