Download
1 / 19
200 likes | 335 Views
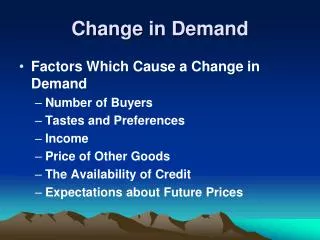
World Energy Outlook: Key trends, challenges and policy responses Dr. Fatih Birol IEA Chief Economist. Change in world oil demand in the Reference Scenario, 2008-2030. China. Middle East. India. Other Asia. Latin America. Africa. E. Europe/Eurasia. OECD Europe. OECD Pacific.

E N D
World Energy Outlook:Key trends, challenges and policy responses Dr. Fatih BirolIEA Chief Economist
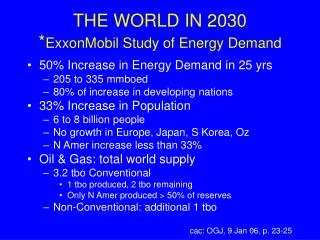
Change in world oil demand in the Reference Scenario, 2008-2030 China Middle East India Other Asia Latin America Africa E. Europe/Eurasia OECD Europe OECD Pacific OECD N.America - 4 - 2 0 2 4 6 8 10 12 mb/d Most of the growth in oil demand comes from developing Asia & the Middle East, with demand falling in OECD regions due to saturation and improved vehicle fuel economy
Worldwide upstream oil & gas capital expenditures 500 11% 19% Billion dollars 400 300 200 100 0 2000 2001 2002 2003 2004 2005 2006 2007 2008 2009 2010* * Estimated spending Global upstream spending fell in 2009, for the first time in a decade, by over $90 billion in 2009, but is set to bounce back by around 10% in 2010 on current plans
Where would the oil come from? 120 Unconventional mb/d 100 Other OPEC 80 Middle East OPEC 60 Non-OPEC 40 20 0 2000 2008 2015 2030 OPEC takes the lion’s share of the growth in oil supply as conventional non-OPEC production soon peaks, with unconventional oil also playing a growing role
What future for Iraqi oil ? • Iraq: a decisive driver of global oil markets in the coming decade? • Iraqi oilfields are mostly technically straightforward and relatively cheap to develop • The very rapid capacity expansion claimed by politicians is overly optimistic • But even a modest achievement – e.g. a doubling of current production – would have a significant impact on global oil markets • Main challenges: security, infrastructure, water and personnel
Oil import bills as share of GDP, 2009 3.0% 2.5% 2.0% 1.5% 1.0% 0.5% 0% European United Japan China Turkey Union States Turkey 's oil import bills likely to grow and put increasing pressure on the economy
US natural gas supply in the Reference Scenario 700 bcm Net imports 600 Conventional Unconventional 500 400 300 200 100 0 1990 1995 2000 2005 2008 2015 2020 2025 2030 Mainly as a result of shale gas production growth, US gas output grows gradually through to 2030, outstripping US demand & squeezing US net imports
Natural gas transportation capacity 800 bcm Unutilised LNG liquefaction & pipeline capacity 73% 700 600 LNG trade 88% 500 Pipeline trade 400 % Capacity utilisation rate 300 200 100 0 2007 2015 A glut of gas is developing – reaching 200 bcm by 2015 – due to weaker than expected demand & plentiful US unconventional supply, with far-reaching implications for gas pricing
More on natural gas • Pace of global economic recovery is key to gas and electricity demand prospects • Pressure on oil-indexed pricing – more innovative gas pricing formulae? • Growing interest in LNG –less appetite for pipe line gas • More unconventional gas: can the North American success story be replicated elsewhere ? • Gas glut: putting pressure on renewables and others ?
Limiting temperature rise to 2 degrees requires big & quick emission reductions in all regions Abatement of world energy-related CO2 emissions in the 450 Scenario Gt 42 World abatement by technology, 2030 Reference Scenario 40 38 Efficiency - 57% 36 34 13.8 Gt 3.8 Gt 32 Renewables & biofuels - 23% 30 Nuclear - 10% 28 CCS - 10% 450 Scenario 26 2007 2010 2015 2020 2025 2030 • An additional $10.5 trillion of investment is needed in total in the 450 Scenario, with measures to boost energy efficiency accounting for most of the abatement through to 2030
Incremental EU electricity productionby scenario, 2008-2030 800 Reference Scenario TWh 600 450 Scenario 400 200 0 - 200 - 400 - 600 - 800 Coal Gas Oil Nuclear Hydro Wind Biomass Solar Other renewables • Renewables, nuclear and plants fitted with CCS account for 80% of electricity generation in EU in 2030 in the 450 Scenario, up from 44% today
Growing interest in nuclear - capacity under construction China Russia Non-OECD 24 7 3 8 India Other Pacific Europe OECD 8 4 1 North America 0 10 20 30 40 50 GW • More than three-fourths of the 55 GW of nuclear capacity currently under construction • is located in the non-OECD, with over 40% in China alone
European Union passenger vehicle sales in the 450 Scenario 100% Electric vehicles Plug-in hybrids 80% Hybrid vehicles ICE vehicles 60% 40% 20% 0% 2007 2020 2030 The 450 Scenario represents a radical departure from historical trends in fuel and engine technology, which will require significant policy support and appropriate pricing signals
Global CO2 emissions from the power sectorand the use of electric cars Electric vehicle, 450 Scenario, 2030 Electric vehicle, present Gasoline ICE vehicle, present 0 20 40 60 80 100 120 140 160 180 Grammes CO2/km • Electric cars only are not enough: a holistic approach is required, reducing CO2 emissions of the power generation system too…
EU primary natural gas imports by scenario 600 Bcm Reference Scenario +65% (204 bcm) 450 Scenario 500 +37% (116 bcm) 400 300 200 100 0 2007 2015 2020 2025 2030 • EU gas imports continue to grow in the 450 Scenario, but plateaus by around mid-2020s
What does the Copenhagen Accord entail? • A politically significant step towards a legally binding deal: • Recognises the need to limit the global temperature increase to 2C • Sets a goal of mobilising $100 billion/year of funding for mitigation & adaptation from developed to developing countries by 2020 • Several countries made pledges by 2020; • The Conference took note of the Accord, but not binding and no guarantee of real action • Will the accord pave the way for a much stronger deal later to ensure that the 2C goal is achieved?
World abatement of energy-related CO2 emissionsin the 450 Scenario Gt 42 Reference Scenario Reference Scenario 40 Current Pledges 38 36 450 Scenario 34 13.8 Gt 3.8 Gt 32 30 28 450 Scenario 26 2007 2010 2015 2020 2025 2030 • Current pledges point in the right direction but further efforts would be needed to reach the 450 Scenario
Summary & conclusions • The financial crisis has halted the rise in global energy use, but its long-term upward path will resume soon on current policies • Oil investment has fallen sharply, posing questions on medium term supply • Iraq can play a decisive role shaping the oil market outlook • A sizable glut of natural gas is looming – with major implications for gas markets • Major growth potential in alternative energy technologies – nuclear, renewables, advance car technologies