Download
1 / 14
140 likes | 232 Views
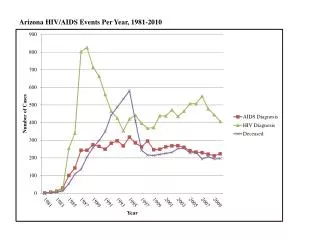
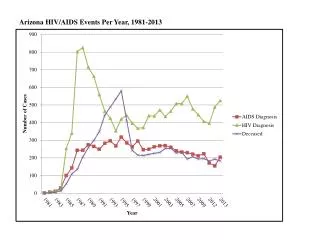
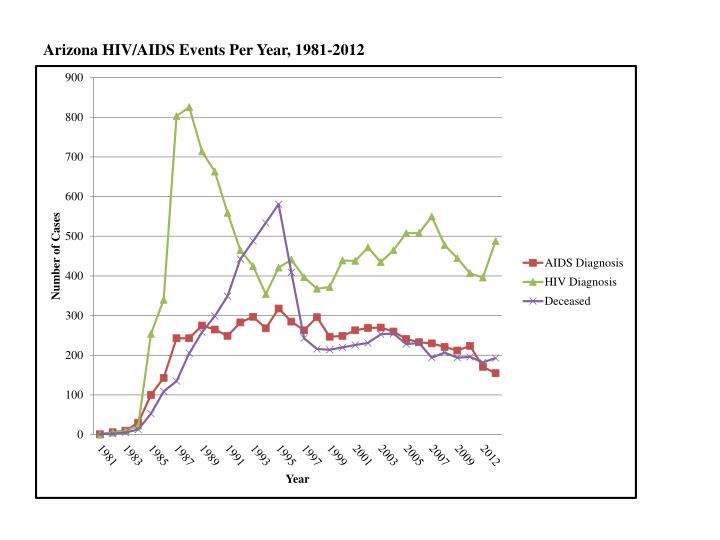
Arizona HIV/AIDS Events Per Year, 1981-2012. Arizona Emergent HIV/AIDS Diagnoses, 1999-2012. Arizona 5-Year Emergent HIV/AIDS Case Rate Trend, 1990-2011. Arizona Single-Year Emergent HIV/AIDS Case Trend, 1990-2012. Arizona Prevalent HIV, AIDS, and HIV/AIDS cases, December 2004 – December 2012.

E N D
Arizona Prevalent HIV, AIDS, and HIV/AIDS cases, December 2004 – December 2012
Arizona County-Specific Prevalent HIV/AIDS, 2012 State Prevalence Rate= 233 per 100,000 *Incarcerated cases removed. 49% of prevalent cases in Pinal are currently incarcerated, and the rate before removal was 231. **Incarcerated cases removed. 37% of prevalent cases in Graham County are currently incarcerated, and the rate before removal was 81
Arizona County-Specific Emergent HIV/AIDS, 2007-2011 State Emergence Rate = 10.3 per 100,000 *Incarcerated cases removed. 61% of incident cases in Pinal were incarcerated at the time of diagnosis, and the rate before removal was 14 **Incarcerated cases removed. 33% of incident cases in Graham were incarcerated at the time of diagnosis, and the rate before removal was 5
Arizona County-Specific Emergent HIV/AIDS, 2012 State Emergence Rate = 9.81 per 100,000 * Incarcerated cases removed. 63% of incident cases in Pinal were incarcerated at the time of diagnosis. The rate before removal was 5.6 * * These counties had 0 incident cases in 2012.
Arizona 5-Year New HIV/AIDS Rate by Race/Ethnicity, 1990-2011 *Non-Hispanic, A/PI/H=Asian/Pacific Islander/Native Hawaiian, AI/AN=American Indian/Alaska Native
Arizona Relative Percentage of Emergent Cases by Reported Risk Behavior, 1990-2011
Male United States and Arizona Estimates of New HIV Infections, By Transmission Category MSM =Men Who Have Sex with Men IDU = Injection Drug User HET= High-Risk HeterosexualNRR =No Risk Reported The United States estimate does not include an NRR category
Female United States and Arizona Estimates of New HIV Infections, By Transmission Category MSM =Men Who Have Sex with Men IDU = Injection Drug User HET= High-Risk HeterosexualNRR =No Risk Reported The United States estimate does not include an NRR category
Arizona Lifetime Comorbidity Patterns Among Persons Diagnosed with HIV/AIDS, Sexually Transmitted Diseases or Hepatitis C, 1998-2008