Download
1 / 22
220 likes | 344 Views
From Molecules to Networks to Behavior. cognition. behavior. Jeffrey R. Petrella , MD Associate Professor of Radiology Director, Alzheimer’s Imaging Research Laboratory Duke University Medical Center, Durham NC. temperment. Clinical Progression of AD and MCI. Time (y). 1-10 y. 0 y.

E N D
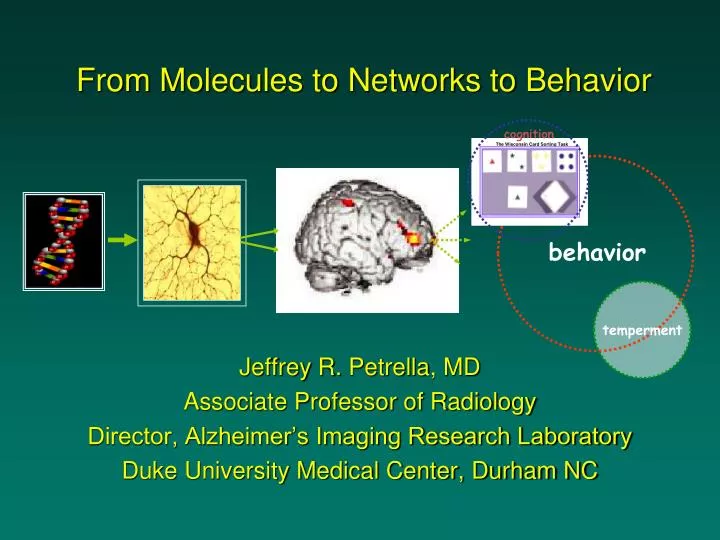
From Molecules to Networks to Behavior cognition behavior Jeffrey R. Petrella, MD Associate Professor of Radiology Director, Alzheimer’s Imaging Research Laboratory Duke University Medical Center, Durham NC temperment
Clinical Progression of AD and MCI Time (y) 1-10 y 0 y 10 y MCIMMSE 24–30 Mild ADMMSE 20–23 • Mild subjective/objective memory loss • Normal function • Forgetfulness • Repetitive questions • Daily function impaired Moderate ADMMSE 10–19 • Progression of cognitive deficits • Short-term memory loss • Word-finding difficulties Cognitive function Severe ADMMSE 0–9 • Agitation • Altered sleep patterns • Total dependence: dressing, feeding, bathing
Evolution of the Disease Neurofibrillary Changes in Early AD Early Stage Middle Stage Adapted from: Braak H, Braak E. Acta Neuropathol (Berl). 1991;82:239-259
Amyloid Accumulation Plateaus Early Petersen RC, Jack CR, Clinical Pharmacology & Therapeutics (2009) 86 4, 438–441
Cell damageCell death Pathophysiology of Alzheimer’s Disease Genetic Amyloid Inflammation Risk Tangles Oxidation Neuropsychologic Testing CSF, Blood Biomarkers MR Perfusion fMRI DTI Symptoms Birth 60 100 Molecular Imaging FDG- PET MR Spectro-scopy Quantitative/ Structural MR Years Reproduced from Doraiswamy 2000, Sunderland 1999
Paradigm Petrella et al., Radiology 2006
Hippocampal Activation @ 4T Encode: novel vs familiar
Distribution of Left and Right Hippocampal Voxel Counts (normalized, age-adjusted) and MMSE (age-adjusted) in MCI and Control subjects
Control 3 MCI y = -0.1002x + 0.5029 2 AD 2 R = 0.2524 1 0 -1 -2 -1 4 9 14 19 Signal Intensity (Petrella et al, Radiology, 2007) CVLT-II delayed recall score
Activation Parameter Estimate Activation Parameter Estimate PMC region of interest (Petrella, et al., PLoS ONE Oct 2007)
APOE E3 – E4 Rieman EM et al, PNAS 2004
Cortical “Hubs” Buckner et al., Journal of Neuroscience (2009)
Cortical Connectivity and Amyloid Deposition Buckner et al., Journal of Neuroscience (2009)
DMN Integrity and Amyloid Burden Sperling RA et al. Neuron 2009
Neurodegenerative Diseases Target Large-Scale Human Brain Networks Seeley WW et al., Neuron 2009
Graph Theoretical Network Analysis Adapted from Stam CJ Cerebral Cortex 2006
Construction of Structural Cortical Networks Adapted from He, Chen and Evans, J Neurosci 2008
Loss of Small World Network Characteristics in Alzheimer’s Disease Path Length Cluster Coefficient Small Worldness Supekar PLoS Comp Biol 2008
Topological Robustness in Structural Cortical Networks He, Chen and Evans, J Neurosci 2008
Summary cognition behavior temperament Cells: subtle molecular bottlenecks Genes: multiple alleles each of small effect Systems: Variable development/ information processing Behavior: complex functional interactions and emergent phenomena