Download
1 / 30
300 likes | 393 Views
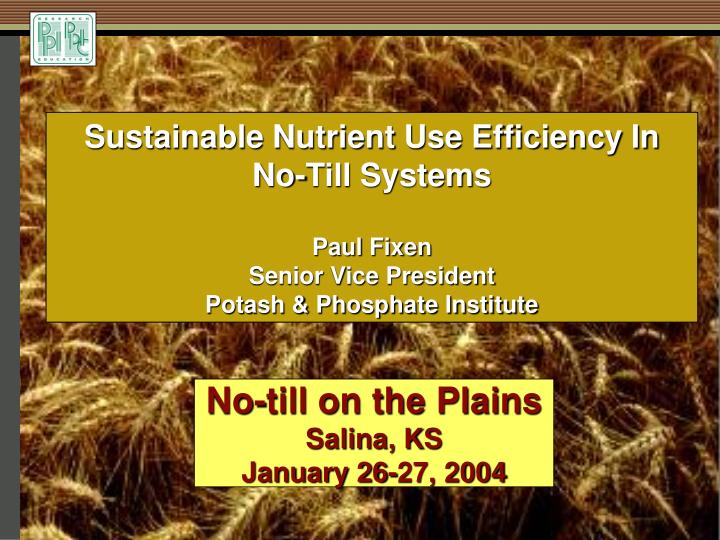
No-till on the Plains Salina, KS January 26-27, 2004. Sustainable Nutrient Use Efficiency In No-Till Systems Paul Fixen Senior Vice President Potash & Phosphate Institute. Sustainable nutrient use efficiency (NUE) in no-till systems. Why the increased emphasis on NUE? Definition of NUE

E N D
No-till on the PlainsSalina, KS January 26-27, 2004 Sustainable Nutrient Use Efficiency In No-Till Systems Paul Fixen Senior Vice President Potash & Phosphate Institute
Sustainable nutrient use efficiency (NUE) in no-till systems • Why the increased emphasis on NUE? • Definition of NUE • Sustainable NUE • Special considerations for no-till • So what? … What does this mean to me?
Why the emphasis on NUE? • Input costs are increasing • U.S. natural gas prices will remain higher than traditional levels … N prices will as well • Increasing pressure to minimize negative environmental impacts • Global, national, state, and local levels • Water and air quality concerns • Government incentive programs encouraging practices that increase NUE • Development and promotion of products that promise increased NUE
Nutrient use efficiency functional definitions • Recovery efficiency = Increase in uptake by the plant per unit nutrient added usually expressed as % • Example: N uptake when no N applied = 30 lb/A N uptake when 100 lb applied = 90 lb/A (90-30)/100 = 60% recovery • Agronomic efficiency (AE) = Crop yield increase per unit nutrient added usually expressed as bu/lb • Example: Corn yield = 150 bu/A N applied = 100 lb/A 150/100 = 1.5 bu/lb
39% increase in agonomic efficiency 12% increase in N fertilizer use 40% increase in corn yields Since 1975: Agronomic efficiency of fertilizer N used on corn grain in the U.S., 1964-2002 Recovery efficiency often less than 50% 1.06 0.76
Effect of P on agronomic use efficiency of N on irrigated corn MEY: 186 bu/A MEY N rate: 159 lb/A Agron effec= 1.17 bu/lb MEY: 129 bu/A MEY N rate: 145 lb/A Agron effec = 0.89 bu/lb Kansas; 30-year mean Source: Schlegel et al., 1996
Balanced nutrition increases N recovery efficiency • Kansas State University – irrigated corn • No P applied 35% N recovery • 40 lb P2O5/A 75% N recovery
Is maximum NUE our goal? MEY: 186 bu/A MEY N rate: 159 lb/A Agron effec = 1.17 bu/lb Yield: 134 bu/A N rate: 40 lb/A Agron effec = 3.35 bu/lb Kansas; 30-year mean Source: Schlegel et al., 1996
Is maximum NUE our goal? • No • Nutrient use should be efficient and effective • Effective – accomplishes the objectives of nutrient use • Meets production needs for yield and quality • Optimizes profitability • Sustains soil, water and air quality • Where N separates from P and K • Sustainable NUE incorporates the elements of effectiveness … our goal
Garcia, 2002 Relative yield, % Agronomic efficiency and soil test P
Nitrogen: Good 1st yr recovery is 60% Phosphorus: Good 1st yr recovery is 20% • 40% unrecovered • Potential fate • Part of soil OM or resid. NO3- • Lost in runoff or erosion • Volatilized from soil or plants • Leached below root zone • Denitrified to air • Losses can be large • 80% unrecovered • Potential fate • Part of soil OM • Lost in runoff or erosion • Fixed as unavailable P • Contribute to soil test P – vast majority • Losses usually minor N vs P recovery efficiency and issues
Residual effects of a single P application over a 14-year period Check tested 17 ppm in fall of 1975 when P was applied. Webb et al., 1992
Examples of apparent recovery efficiency of P fertilizer in long term studies GH = Green house; F = Field. Fixen, 1992
The primary cause of low short term recovery of P fertilizer the inability of P to move to absorbing roots
Root 0.12” 0.5” P diffusion zone Distance between roots Spring Wheat Roots at 38 Daysbased on average root density in surface 6” 5% of soil volume can contribute P to the plant
0.24” Distance between roots Spring Wheat Roots at 94 Daysbased on average root density in surface 6” Root 0.13” P diffusion zone 26% of soil volume can contribute P to the plant
Produce glomalin • A major form of stable OM • Stabilizes soil aggregates • Sequesters carbon Mycorrhizae … an efficiency enhancing fungus encouraged by no-till systems • Increases the “reach” of plant roots • Decline with increasing P fertility, tillage S. Wright, ARS
Where short term recovery is most critical • Short land tenure • Limited operating capital and sub-optimal soil test levels • Soils with severe P fixing potential (rare in Plains and Midwest) • Threat to water quality
Broadcast + successive banding vs.successive banding only Amount broadcastinitially, lb P2O5/A 110 160 100 0 90 Relative yield,percent of maximum 80 70 5-yr averages 60 0 10 20 30 40 Annual rate of seed placed P, lb P2O5/A Wager et al., 1986
Sustainable NUE for P brings the management focus to soil test P and your nutrient budget • Define a target P level based on: • Local calibration data, land tenure, etc. • If current level is less than target • Rate should exceed removal • If current level is greater than target • Rate should be less than removal
Partial P budget for Kansas (average of 1998-2000) 1 Potash & Phosphate Institute (using 0.35 lb P2O5 /bu of corn). 2 Terry and Kirby, 2000, 2001. 3 NRCS, (1997 production).
Percent of soils testing medium or lower in P (2001) Ratio of P removal by crops to fertilizer + manure P use Ratio of P removal by crops to fertilizer use AB AB AB MB MB MB 1.15 0.90 SK SK SK 59 1.36 1.27 86 73 0.98 0.86 78 MT MT MT 1.24 1.21 1.10 1.06 ND ND ND 78 69 1.69 1.41 SD SD SD 0.68 WY WY WY 58 0.79 59 1.63 1.16 NE NE NE CO CO CO 1.80 1.03 60 46 1.48 1.10 KS KS KS 1.17 0.82 OK OK OK NM NM NM 68 57 1.69 0.90 TX TX TX 0.86 0.56 59
Know your nutrient budgets • Inputs: yield history, fertilizer history, manure history • Subtract removal from nutrient additions = balance • Calculations can be done by hand or with software • Example: PKalc www.ppi-ppic.org/toolbox
Evaluation of new products promising increased NUE • Be skeptical • What’s the mechanism? • University data … not just testimonials • Do the arithmetic – NO FREE LUNCH • Is it simply mining soil nutrients which will eventually need replacement • But … be open minded • Some new products do look promising • Test on small acreage with check strips
For 140 bu/A corn lb P2O5/A Sufficiency approach 4-year build approach New KSU recommendations offer range of build targets and build rates because these are farmer specific • Target level and rate of build depends on: • Risk management • Land tenure • Within-field variability • Capital supply Crop removal = 46 lb
Influence of no-till on target soil test levels • Phosphorus • Highly stratified with depth • Has rarely caused problems • No adjustment in target levels • Potassium • Also stratified with depth • Has resulted in availability problems • Target soil test levels could be higher unless subsurface placement is used
Cause of response Based on drop-out treatments Interaction between population and nutrient management for irrigated ridge-till corn in Kansas 1 Plus 230 lb N/A with 2 splits (preplant, V4). 2 KSU recommendation. Carr site Bray P1 = 20 ppm, K = 240 ppm Crete site Bray P1 = 25 ppm, K = 180 ppm. High yield systems under reduced tillage may have higher soil test level requirements Gordon (KSU), 2004
Optimum placement and timing … the traditional focus of managing for high NUE • For N, always important (along with getting the rate right) • For P (and K) • Most important at low soil test levels • Higher the soil test levels, the greater the flexibility in placement • Localized band applications may be important for “starter” effects on crops such as corn or wheat independent of impacts on NUE • Insurance against sub-optimal soil test levels and within field variability • Reduces the negative impact of growing season limitations • Protection against variety-specific weaknesses
What does this mean to me? • Incentives are increasing for efficient and effective nutrient use … sustainable nutrient use effciency • Good time to review nutrient management practices • Efficiency is influenced by nutrient balance … paying attention to all needed nutrients (soil testing, plant analysis, local research) • The focus for N efficiency should be on 1st year results • Managing for efficient P use (and K) is best accomplished when a longer time horizon is considered • Establish and maintain target soil fertility levels • Consider the impact of practices on future productivity as well as 1st year results