Download
1 / 68
680 likes | 684 Views
This presentation provides an overview of the global carbon budget, including emissions from fossil fuel use and industry, projections for future emissions, and various scenarios for addressing climate change.

E N D
Global Carbon Budget Published on 7 December 2015 2015 PowerPoint version 1.02 (updated 25 January 2016)
The work presented here has been possible thanks to the enormous observational and modeling efforts of the institutions and networks below Acknowledgements Atmospheric inversions CarbonTracker (Peters et al. 2010) Jena CarboScope (Rödenbeck et al. 2003) MACC (Chevallier et al. 2005) Land models CLM4-5BGC| ISAM | JSBACH | JULES | LPJ-GUESS | LPJ | LPJmL | OCNv1.r240 | ORCHIDEE | VEGAS | VISIT Ocean models NEMO-PlankTOM5 | NEMO-PISCES (IPSL) | CCSM-BEC | MICOM-HAMMOC | MPIOM-HAMMOC | NEMO-PISCES (CNRM) | CSIRO | MITgem-REcoM2 SOCAT SOCATv3 (Bakker et al. 2014, 2015) Ocean Data products Jena CarboScope (Rödenbeck et al. 2014) Landschützer et al. 2015 Atmospheric CO2datasets NOAA/ESRL (Dlugokencky et al. 2015) Scripps (Keeling et al. 1976) Fossil Fuels and Industry CDIAC (Boden et al. 2015) USGS, 2015 UNFCCC, 2015 BP, 2015 Consumption Emission Peters et al. 2011 Land-Use Change Houghton et al. 2012 van der Werf et al. 2010 Full references provided in Le Quéré et al 2015
Contributors 106people | 68organisations | 15 countries C Le Quéré UK | R MoriartyUK | RM Andrew Norway | JG Canadell Australia | S Sitch UK | JI KorsbakkenNorway | P Friedlingstein UK | GP Peters Norway | RJ Andres USA | TA Boden USA | RA Houghton USA | JI House UK | RF Keeling USA | P Tans USA | A Arneth Germany | DCE Bakker UK | L BarberoUSA | L Bopp France | J Chang France | F ChevallierFrance | LP Chini USA | P Ciais France | M Fader France | RA Feely USA | T GkritzalisBelgium | I Harris UK | J Hauck Germany | T IlyinaGermany | AK Jain USA | E Kato Japan | V KitidisUK | K Klein Netherlands | C Koven USA | P Landschützer Switzerland | SK LauvsetNorway | N Lefèvre France | A LentonAustralia | ID Lima USA | N MetzlFrance | F MilleroUSA | DR Munro USA | A Murata Japan | JEMS NabelGermany | S NakaokaJapan | Y Nojiri Japan| K O'Brien USA | A Olsen Norway | T Ono Japan | FF Pérez Spain | B Pfeil Norway | D PierrotUSA | B Poulter USA | G RehderGermany| C Rödenbeck Germany| S Saito Japan| U Schuster UK| J Schwinger Norway| R SéférianFrance| T Steinhoff Germany| BD Stocker Switzerland| AJ Sutton USA| T Takahashi USA| B Tilbrook Australia| IT van der Laan-Luijkx Netherlands| GR van der WerfNetherlands| S van Heuven Netherlands| D VandemarkUSA| N Viovy France| A Wiltshire UK| S Zaehle Germany| N ZengUSA | R Jackson USA| P Smith UK| SJ Davis USA| F CreutzigGermany | S Fuss Germany | J Minx Germany | B Gabrielle France| A CowieAustralia | E KrieglerGermany| DP van VuurenNetherlands | J RogeljSwitzerland & Austria | J Milne USA| D McCollum Austria| V KreyAustria| G Shrestha USA| T GasserFrance| A Grübler Austria| WK Heidug Saudi Arabia| M Jonas Austria| CD Jones UK| F KraxnerAustria| E Littleton UK| J Lowe UK| JR Moreira Brazil| N Nakicenovic Austria| MObersteinerAustria| A Patwardhan USA| M RognerAustria| E Rubin USA| A SharifiJapan | A Torvanger Norway| Y YamagataJapan | J Edmonds USA| C Yongsung Seoul | S Soloman USA Science Committee | Atlas Engineers at LSCE, France (not already mentioned above), France PPeylin| A Peregon | P Brockmann | V Maigné | P Evano Atlas Designers WeDoData, France| Infographic designers UK, France & Sweden K Bastien | Brice Terdjman | V Le Jeune | A Vessière | Nigel Hawtin| BNPParibas Design Team | azote Communications Team A Minns | O Gaffney | L Sayer | L Horton
Data access More information, data sources and data files: www.globalcarbonproject.org Contact: c.lequere@uea.ac.uk More information, data sources and data files: www.globalcarbonatlas.org Contact: philippe.ciais@lsce.ipsl.fr
All the data is shown in billion tonnes CO2 (GtCO2) 1 Gigatonne (Gt) = 1 billion tonnes = 1×10¹⁵g = 1 Petagram (Pg) 1 kg carbon (C) = 3.664 kg carbon dioxide (CO2) 1 GtC = 3.664 billion tonnes CO2 = 3.664 GtCO2 Disclaimer The Global Carbon Budget and the information presented here are intended for those interested in learning about the carbon cycle, and how human activities are changing it. The information contained herein is provided as a public service, with the understanding that the Global Carbon Project team make no warranties, either expressed or implied, concerning the accuracy, completeness, reliability, or suitability of the information.
Emissions from fossil fuel use and industry Global emissions from fossil fuel and industry: 35.9 ± 1.8 GtCO2 in 2014, 60% over 1990 Projection for 2015: 35.7 ± 1.8GtCO2, 59% over 1990 Estimates for 2012, 2013, 2014, and 2015 are preliminarySource: CDIAC;Le Quéré et al 2015;Global Carbon Budget 2015 Uncertainty is ±5% for one standard deviation (IPCC “likely” range)
Observed emissions and emissions scenarios The emission pledges submitted to the Paris climate summit avoid the worst effects of climate change (red), most studies suggest a likely temperature increase of about 3°C (brown) Over 1000 scenarios from the IPCC Fifth Assessment Report are shownSource: Fuss et al 2014;CDIAC; Global Carbon Budget 2015
Top fossil fuel emitters The top four emitters in 2014 covered 59% of global emissions China (27%), United States (15%), EU28 (10%), India (7%) Bunker fuels are used for international transport is 3.0% of global emissionsStatistical differences are between the global estimates and sum of national totals is 1.1% of global emissionsSource: CDIAC; Le Quéré et al 2015;Global Carbon Budget 2015
Top fossil fuel emitters (per capita) Countries have a broad range of per capita emissions reflecting their national circumstances China’s per capita emissions have passed the EU28 and are 43% above the global average Source: CDIAC; Le Quéré et al 2015;Global Carbon Budget 2015
Consumption-based emissions (carbon footprint) Allocating emissions to the consumption of goods and services provides an alternative perspective on emission drivers Consumption-based emissions are calculated by adjusting the standard production-based emissions to account for international tradeSource: Le Quéré et al 2015;Peters et al 2011;Global Carbon Project 2015
Alternative rankings of countries Depending on perspective, the significance of individual countries changes GDP: Gross Domestic Product in Market Exchange Rates (MER) and Purchasing Power Parity (PPP)Source: CDIAC;United Nations; Le Quéré et al 2015; Global Carbon Budget 2015
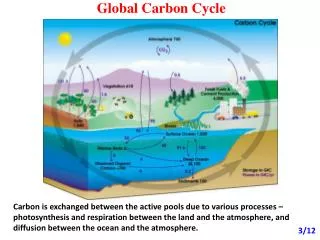
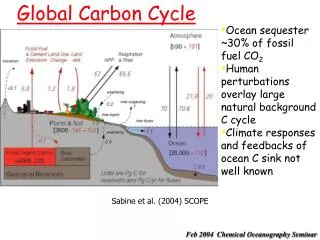
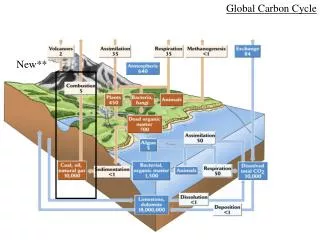
Anthropogenic perturbation of the global carbon cycle Perturbation of the global carbon cycle caused by anthropogenic activities,averaged globally for the decade 2005–2014 (GtCO2/yr) Source: CDIAC; NOAA-ESRL; Le Quéré et al 2015;Global Carbon Budget 2015
Global carbon budget The carbon sources from fossil fuels, industry, and land use change emissions are balanced by the atmosphere and carbon sinks on landand in the ocean Source: CDIAC; NOAA-ESRL; Houghton et al 2012; Giglio et al 2013; Joos et al 2013; Khatiwala et al 2013; Le Quéré et al 2015;Global Carbon Budget 2015
Global carbon budget The cumulative contributions to the global carbon budget from 1870 Figure concept from Shrink That FootprintSource: CDIAC; NOAA-ESRL; Houghton et al 2012; Giglio et al 2013; Joos et al 2013; Khatiwala et al 2013; Le Quéré et al 2015;Global Carbon Budget 2015
Atmospheric concentration The global CO2 concentration increased from ~277ppm in 1750 to 397ppm in 2014 (up 43%) Mauna Loa registered the first seasonally-corrected monthly mean over 400ppm in March 2015 Globally averaged surface atmospheric CO2 concentration. Data from: NOAA-ESRL after 1980; the Scripps Institution of Oceanography before 1980 (harmonised to recent data by adding 0.542ppm)Source: NOAA-ESRL; Scripps Institution of Oceanography;Global Carbon Budget 2015
Emissions from fossil fuel use and industry Global CO2 emissions from fossil fuel use and industry (left axis) and emissions per unit economic activity (right axis). Red symbols are projections for 2015 GDP: Gross Domestic Product using Purchasing Power Parity Source: Jackson et al 2015a; Global Carbon Budget 2015
Energy consumption by energy type - China Energy consumption by fuel source from 2000 to 2014, with growth rates indicated for the more recent period of 2010 to 2014 for China Source: BP 2015; Jackson et al 2015; Global Carbon Budget 2015
Energy consumption by energy type - India Energy consumption by fuel source from 2000 to 2014, with growth rates indicated for the more recent period of 2010 to 2014 for India Source: BP 2015; Jackson et al 2015; Global Carbon Budget 2015
Energy consumption by energy type - global Energy consumption by fuel source from 2000 to 2014, with growth rates indicated for the more recent period of 2010 to 2014for the globe Source: BP 2015; Jackson et al 2015; Global Carbon Budget 2015
Change in CO2 emissions from fossil-fuel use and industry Top: Annual change in global CO2 emissions relative to 2011 Bottom:Annual for the EU, US, China, India, and the rest of the world The most recent projected change in emissions is from ~35.9 CO2 (9.8 Gt C) in 2014 to ~35.7 Gt CO2 (9.7 Gt C) in 2015. The filled symbols for 2015 denote projections. Source: Jackson et al 2015; Global Carbon Budget 2015
Cumulative global CO2 emissions and temperature Cumulative global CO2 emissions from fossil fuels, industry, and land use change and four simplified future pathways compared to probability of exceeding different temperatures (red) The red shaded areas are the chance of exceeding different temperatures above pre-industrial levels using the cumulative emissions concept Source: Jackson et al 2015b; Global Carbon Budget 2015
Different Negative Emission Technologies Schematic representation of carbon flows among atmospheric, land, ocean and geological reservoirs for different technologies Source: Smith et al 2015;Global Carbon Budget 2015
Impact/limit summary for Negative Emission Technologies The impacts and investment requirements of Negative Emissions Technologies to limit warming to 2°C Water requirement is shown as water droplets, with quantities in km3per year. All values are for the year 2100 except relative costs, which are for 2050 Source: Smith et al 2015; Global Carbon Budget 2015
Global Negative Emission Technologies capacity Factors potentially enhancing or limiting the global capacity for Negative Emission Technologies Source: Smith et al 2015; Global Carbon Budget 2015
Scenarios including Negative Emission Technologies Scenarios including Negative Emission Technologiesfor each scenario category (colours), net land use change fluxes are included Scenarios with Negative Emissions Technologies from the AMPERE and LIMITS modelling comparison exercises (colours), with all other scenarios from the IPCC AR5 database shown in grey Source: Smith et al 2015; Global Carbon Budget 2015
The remaining carbon quota for 66% chance <2°C The total remaining emissions from 2014 to keep global average temperature below 2°C (900GtCO2) will be used in around 20 years at current emission rates Grey: Total quota for 2°C. Green: Removed from quota. Blue: remaining quota. With projected 2015 emissions, this remaining quota drops to 865 Gt CO2 Source: Peters et al 2015; Global Carbon Budget 2015
The emission pledges (INDCs) of the top-4 emitters Equity: Remaining quota shared by current population. Inertia: The remaining quota shared by current emissions. Source: Peters et al 2015; Global Carbon Budget 2015 The emission pledges compared to different ways of sharing the remaining 2°C quota
The emission pledges (INDCs) of the top-4 emitters The emission pledges from the US, EU, China, and India leave little room for other countries to emit in a 2°C emission budget (66% chance) Source: Peters et al 2015; Global Carbon Budget 2015
The emission pledges (INDCs) of the top-4 emitters To remain consistent with 2°C and given the emission pledges from the US, EU, China, and India, the ‘Rest of the World’ would need zero per-capita emissions by 2030 Source: Peters et al 2015; Global Carbon Budget 2015
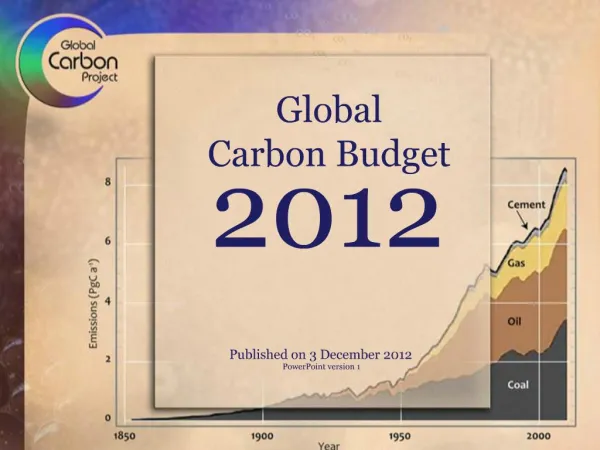
Emissions from coal, oil, gas, cement Share of global emissions in 2014:coal (42%), oil (33%), gas (19%), cement (6%), flaring (1%, not shown) Source: CDIAC; Le Quéré et al 2015;Global Carbon Budget 2015
Fossil fuel and industry emissions growth Coal accounted for 26% of the growth in global emissions in 2014,oil 41%, gas 11%, and cement 22%. Source: CDIAC; Le Quéré et al 2015;Global Carbon Budget 2015
Fossil fuel and cement emissions growth Much of the growth in emissions in 2014 was in India and China,while Europe’s emissions declined Figure shows the top four countries contributing to emissions changes in 2014Source: CDIAC; Le Quéré et al 2015; Global Carbon Budget 2015
Breakdown of global emissions by country Emissions from Annex B countries have slightly declined since 1990Emissions from non-Annex B countries have increased rapidly in the last decade Annex B countries had emission commitments in the Kyoto Protocol (excluding Canada and USA)Source: CDIAC; Le Quéré et al 2015;Global Carbon Budget 2015
Historical cumulative emissions by country Cumulative emissions from fossil-fuel and cement were distributed (1870–2014):USA (26%), EU28 (23%), China (12%), and India (3%) covering 64% of the total share Cumulative emissions (1990–2014) were distributed USA (20%), China (19%), EU28 (15%), India (5%)‘All others’ includes all other countries along with bunker fuels and statistical differencesSource: CDIAC; Le Quéré et al 2015;Global Carbon Budget 2015
Historical cumulative emissions by continent Cumulative emissions from fossil-fuel and cement (1870–2014)North America and Europe responsible for most cumulative emissions, but Asia growing fast The figure excludes bunker fuels and statistical differencesSource: CDIAC; Le Quéré et al 2015;Global Carbon Budget 2015
Carbon intensity of economic activity - global Financial crises have had little lasting effect on emissions growth Global carbon intensity has returned to a phase of improvement after stalling for some years Economic activity is measured in Purchasing Power Parity Source: CDIAC; Le Quéré et al 2015;Global Carbon Budget 2015
Annex B versus non-Annex B countries There is not a clear distinction between Annex B and non-Annex B countries based on economic activity per capita or emissions per capita GDP is measured here in Market Exchange RatesSource: United Nations;CDIAC; Le Quéré et al 2015; Global Carbon Budget 2015
Emissions intensity of GDP The 10 largest economies have a wide range of emissions intensity of economic production Source: Global Carbon Budget 2015
Emissions intensity per capita The 10 most populous countries span a wide range of development and emissions per person Source: Global Carbon Budget 2015
Source: CDIAC; Le Quéré et al 2015;Global Carbon Budget 2015 Key statistics
Consumption-based emissions Consumption–based emissions allocate emissions to the location that goods and services are consumed Consumption-based emissions = Production/Territorial-based emissions minus emissions embodied in exports plus the emissions embodied in imports
Consumption emissions per the Kyoto Protocol The net emissions transfers into Annex B countries more than offsets the Annex B emission reductions achieved within the Kyoto Protocol Transfers of emissions embodied in trade from non-Annex B countries to Annex B countries grew at about 20% per year between 1990 and 2007, but have since declined at about 3% per year.Source: CDIAC; Peters et al 2011; Le Quéré et al 2015;Global Carbon Budget 2015
Major flows from production to consumption Flows from location of generation of emissions to location of consumption of goods and services Values for 2011. EU is treated as one region. Units: MtCO2Source: Peters et al 2012