Download
1 / 24
270 likes | 1.01k Views
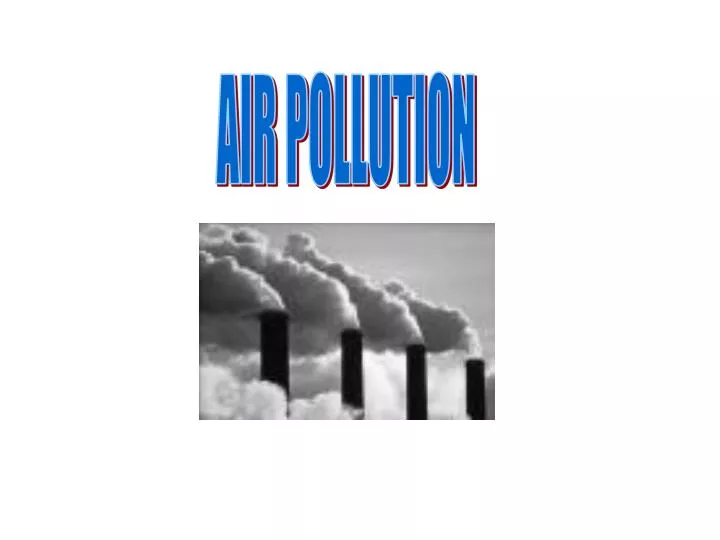
AIR POLLUTION. AIR POLLUTION – chemical or physical changes brought about by either natural processes or human activities resulting in air quality degradation.

E N D
AIR POLLUTION – chemical or physical changes brought about by either natural processes or human activities resulting in air quality degradation.
OVER THE LAST 20 YEARS AIR QUALITY HAS IMPROVED IN DEVELOPED COUNTRIES & BECOME WORSE IN DEVELOPING COUNTRIES (10x’s higher in mega cities) 147 million metric tons of air pollution (not CO2 or dust) is released by the U.S./yr. Natural sources of air pollution – volcanoes, dust storms, sea spray, viruses, bacteria, pollen, spores trees & vegetation (which emit VOC’s). Methane (2/3 ) from decaying vegetation & guts of termites & ruminant animals.
Anthropogenic sources alter & overload natural systems. Although most particulates come from natural causes, in some cities 90% come from human activities. Primary pollutants – directly released from a source into the air in a harmful form. Secondary pollutants – modified to a hazardous form after they enter the air (acid rain or smog) or are formed by chemical reactions as components of the air mix & interact. Example: NOx
Publications National Ambient Air Quality Standards (NAAQS) The Clean Air Act, which was last amended in 1990, requires EPA to set National Ambient Air Quality Standards for pollutants considered harmful to public health and the environment. The Clean Air Act established two types of national air quality standards. Primary standards set limits to protect public health, including the health of "sensitive" populations such as asthmatics, children, and the elderly. Secondary standards set limits to protect public welfare, including protection against decreased visibility, damage to animals, crops, vegetation, and buildings. The EPA Office of Air Quality Planning and Standards (OAQPS) has set National Ambient Air Quality Standards for six principal pollutants, which are called "criteria" pollutants. Units of measure for the standards are parts per million (ppm) by volume, milligrams per cubic meter of air (mg/m3), and micrograms per cubic meter of air (µg/m3).
Understanding the AQI The purpose of the AQI is to help you understand what local air quality means to your health. To make it easier to understand, the AQI is divided into six categories: Each category corresponds to a different level of health concern. The six levels of health concern and what they mean are: "Good" The AQI value for your community is between 0 and 50. Air quality is considered satisfactory, and air pollution poses little or no risk. = GREEN "Moderate" The AQI for your community is between 51 and 100. Air quality is acceptable; however, for some pollutants there may be a moderate health concern for a very small number of people. For example, people who are unusually sensitive to ozone may experience respiratory symptoms. = YELLOW "Unhealthy for Sensitive Groups" When AQI values are between 101 and 150, members of sensitive groups may experience health effects. This means they are likely to be affected at lower levels than the general public. For example, people with lung disease are at greater risk from exposure to ozone, while people with either lung disease or heart disease are at greater risk from exposure to particle pollution. The general public is not likely to be affected when the AQI is in this range. = ORANGE "Unhealthy" Everyone may begin to experience health effects when AQI values are between 151 and 200. Members of sensitive groups may experience more serious health effects. = RED "Very Unhealthy" AQI values between 201 and 300 trigger a health alert, meaning everyone may experience more serious health effects. = PURPLE "Hazardous" AQI values over 300 trigger health warnings of emergency conditions. The entire population is more likely to be affected. = MAROON
Formation of SMOG = Ozone NO + VOC ---------- NO2 NO2 + UV ------------ NO + O (nitric oxide + atomic oxygen O + O2 ------------------ O3 (ozone) NO2 + VOC -------------- PAN, etc. (peroxyacetyl nitrate) NET RESULTS NO + VOC + O2 + UV -------- O3 + PAN, & other oxidants
Ozone - Good Up High, Bad Nearby! • Ozone is a gas composed of three atoms of oxygen. Ozone occurs both in the Earth's upper atmosphere and at ground level. Ozone can be good or bad, depending on where it is found: • Good Ozone. Ozone occurs naturally in the Earth's upper atmosphere-6 to 30 miles above the Earth's surface-where it forms a protective layer that shields us from the sun's harmful ultraviolet rays. This beneficial ozone is gradually being destroyed by manmade chemicals. An area where the protective "ozone layer" has been significantly depleted-for example, over the North or South pole-is sometimes called "the ozone hole." • Bad Ozone. In the Earth's lower atmosphere, near ground level, ozone is formed when pollutants emitted by cars, power plants, industrial boilers, refineries, chemical plants, and other sources react chemically in the presence of sunlight. Ozone at ground level is a harmful air pollutant.
Visiblility 390 km Visiblity 40 km GRAND CANYON
Fugitive emissions – those that do not go through a smoke stack. Examples – dust from soil erosion, strip mining, rock crushing, & building construction & destruction. Leaks around valves & pipe joints from oil refineries & chemical plants.
Unconventional Or Non-criteria Air Pollutants – considered especially toxic or hazardous & are regulated by the EPA. (HAP’s) Asbestos, benzene, beryllium, mercury, polycyhlorinated biphenyls (PCB’s) & vinyl chloride. Most of these materials have no natural source in the environment. PCBs and Chemistry PCBs or polychlorinated biphenyls are a group of chemicals consisting of 209 individual compounds. PCBs were widely used as a fire preventive and insulator in the manufacture of transformers and capacitors because of their ability to withstand exceptionally high temperatures. PCBs were banned by the EPA in 1979, and are classified as a probable human carcinogen by numerous national and international health-protective organizations, such as the EPA, The Agency for Toxic Substances and Disease Registry (an arm of the U.S Public Health Service) and the World Health Organization. Research also links PCB exposure to developmental problems. PCBs build up (bioaccumulate) in the environment, increasing in concentration as you move up the food chain.
Aesthetic degradation – any undesirable changes in the physical characteristics or chemistry of of the atmosphere. Noise, odor, light pollution. Some are not harmful to health but degrade the quality of of our lives.
Climate, topography, & physical processes in the atmosphere plant an important role in transport, concentration, dispersal & removal of many air pollutants. Temperature Inversions – when a stable layer of warmer air overlays cooler air, reversing the normal temperature decline with increasing height.
Urban heat island A city is built mainly of concrete, asphalt, bricks and stones. As air temperature at a certain place depends to a large extent on the surface character, the temperature in a city is higher than in a non-urban area. The urban heat island is also caused by large number of habitants and anthropogenic heat emission. Heat Island map of the New YorkThe hottest surfaces, overlaided in red! (35 K)Source:System for World Surveillance, Inc.
Stratosphere Ozone Formation 1. O2 + UV ----- 2O 2. O + O2 ------- O3 3. O3 + O ---- 2O2 OR 3. O3 + UV ---- O + O2
GENERAL FACTS ON OZONE Ozone is located mainly in the stratosphere 8 – 30 mi. (13 – 48 km) . Ozone amounts are small; there are only a few molecules of zone in a million air molecules at most. Ozone is measured in Dobson Units. If you bring all ozone above a certain location to the ground & measured the height of the ozone, it would equal 300 Dobson Units (D.U.) which is equal to 3 millimeters in height. Less than 200 D.U.’s is considered a HOLE. Ozone filters out biologically damaging UV light. Loss of ozone could cause: 1. Increase in skin cancer & cataracts. 5. More solar radiation warming the troposphere & cooling the stratosphere. 2. Decrease in crop yield. 3. Breakdown of the immune system. 4. Decrease in phytoplankton.
1. CFC’s + sunlight --- Cl released 2. Cl + O3 ----- ClO + O2 3. ClO + O ----- Cl + O2 It takes CFC’s many years to ascend to the stratosphere & once they’re there they can last from 50 – 100 years. One chlorine molecule has the ability to destroy 100,000 or more ozone molecules. http://www.atm.ch.cam.ac.uk/tour/part3.html http://www.shsu.edu/%7Echemistry/ESC440/psc.gif Ozone annimation.
Total Ozone Mapping Spectrometer (TOMS) is an optical sensor to measure the albedo of the earth's atmosphere at six narrow spectral bands. The total ozone content is interrelated with changes of solar radiation in the near ultraviolet wavelengths so that the spatial distribution of the total ozone can be inferred by observing several near UV bands. In addition, the TOMS observation data can be used to make quantitative estimates of sulfur dioxide gases in the near UV band.
The following are international agreements dealing with the ozone depletion problem: A. Montreal Protocol (1987) – 50% cut-back in CFC’s & Halons from 1986 levels. B. Agreement in London (1990) – 100% phase-out by 2000 of CFCs & Halons. C. Agreement in Copenhagen (1992) – U.S.A. & others – Acceleration of phase-out – 100% phase-out by 1996 of CFCs & Halons.
The major parts of the Clean Air Act. 1963, 1970, 1990 & 1997 1963: A pool of money to be used by the states to set limits & regulate air pollution. 1970: Set specific standards for the criteria pollutants, (Also the EPA was established to not only set standards but also enforce them.) 1990: Added acid rain, HAP’s, ozone protection, marketing pollution rights, VOC’s 1997: Proposed lowering troposheric ozone from 0.12 ppm to 0.08 ppm. Lowering soot & dust from 10 microns to 2.5 microns & therefore requiring factories & powerplants to clean up emissions.
Clean Air Act will limit mercury pollution to 5 tons per year by 2008. The Bush Administration’s plan weakens the limit to 26 tons per year by 2010 – allowing 520 percent more mercury pollution. Nitrogen Oxide (NOx) is a major contributor to smog that is linked to asthma and lung disease. Current Clean Air Act programs could result in NOx pollution levels of about 1.25 million tons by 2010. But the Bush plan calls for loosening the cap on NOx pollution to 2.1 million tons by 2008 – effectively allowing 68 percent more NOx pollution. Sulphur Dioxide (SO2) is the major contributor acid rain and soot. Clean Air Act programs could reduce SO2 pollution levels to 2 million tons by 2012. The Bush Administration plan weakens protections to allow 4.5 million tons of SO2 by 2010 – allowing a staggering 225 percent more SO2 pollution. ··