Download

1 / 16
160 likes | 322 Views
Saint John Labour Market Trends August 2012. July 2012 Labour Market Stats for NB and Saint John NB Unemployment Rate – 10.0% Saint John Unemployment Rate – 8.6% . Source: Statistics Canada’s Labour Force Survey/Enquête sur la population active de Statistique Canada.

E N D
Saint John Labour Market Trends August 2012
July 2012 Labour Market Stats for NB and Saint JohnNB Unemployment Rate – 10.0% Saint John Unemployment Rate – 8.6% Source: Statistics Canada’s Labour Force Survey/Enquête sur la population active de Statistique Canada
Saint John Labour Force by Occupation Source: Statistics Canada 2006 Census
Saint John Labour Force by Sector Total labour force: 64,175 • 1. Business Services – 14,020 • 2. Health care and social assistance – 8,020 • 3. Retail trade – 7,865 • 4. Administrative and support – 5,415 • 5. Manufacturing – 5,390 • 6. Construction – 4,410 • 7. Accommodation and food services – 3,960 • 8. Educational services – 3,730 • 9. Professional, scientific and technical services – 3,600 • 10. Public administration – 3,305 • 11. Wholesale trade – 3,280 • 12. Transportation and warehousing – 3,040 • 13. Finance and insurance – 1,905 • 14. Information and cultural industries – 1,895 • 15. Religious, civil, social and professional/labour organizations – 1,005 • 16. Arts, entertainment and recreation – 980 • 17. Utilities – 975 • 18. Personal care services – 910 • 19. Repair and maintenance services – 850 • 20. Real estate and rental and leasing – 825 • 21. Agriculture, forestry, fishing and hunting – 675 • 22. Mining and oil and gas extraction – 625 Source: Statistics Canada 2006 Census
Energy and Advanced Manufacturing in NB 25% of Saint John’s Labour Force
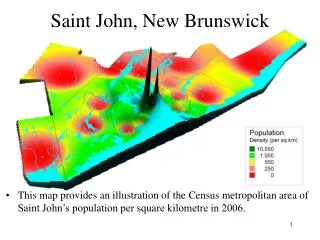
Saint John Labour Force Indicators:Unemployment Rate & Population
Saint John Labour Force Indicators: Labour Force & Employment
Key Indicators for SJ CMA 1971-2006 70,000 60,000 50,000 40,000 30,000 20,000 10,000 0 86 96 06 86 96 06 86 96 06 86 96 06 Residents with university degree Labour force size Population living in poverty Median household income 94% 20 year trend 12% 20 year trend -28% 20 year trend 64% 20 year trend
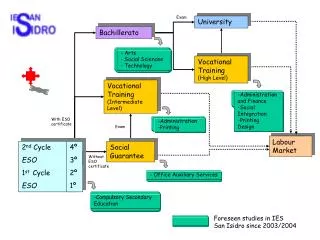
Post-secondary Population • Saint John is home to a variety of post-secondary educational institutes, including: • University of New Brunswick (Saint John Campus) • New Brunswick Community College (largest campus in NB) • Eastern College • There are currently over 6,000 full and part – time students enrolled in post-secondary education institutes
Saint John’s Post-secondary Qualifications – 2006 By Field of Study
Knowledge of Official Languages: English Only 88,955 French Only 145 English & French 16,930 Language by mother tongue: Chinese (Mandarin/Cantonese) 365 Spanish 260 Persian (Farsi) 230 Greek 185 German 170 Tagalog (Pilipino, Filipino) 140 Vietnamese 40 Statistics Canada, 2006 Census Language Capabilities
Average SJ Household Income 2004 - 2008 Average Household Income grew by 20.2% from 2004 to 2008 - $ 63,400 to $ 76,210.
Key Employment trends in SJ CMA1996-2006 • Computer and information systems occupations +1515 • Sales, marketing managers +650 • Auditors, accountants and investment professionals +455 • Registered nursing assistants +205 • University professors and assistants +130 • Civil engineers +95 • Social Workers +75 • Creative Artists +50
Key Employment trends in SJ CMA1996-2006 • Janitors, bldg supers -250 • Industrial electricians -245 • Longshoremen -235 • Machine operators -215 • Metal workers -200 • Service station attendants -165 • Welders -150 • Bank tellers -125 • Journalists -50
Saint John’s Economic Growth Sectors Tourism Energy Advanced Manufacturing Health & Life Sciences Information, Communications & Technology
Enterprise Saint John’s Workforce Development Team Workforce Coordinator: Gina O’Rourke-McKay Labour Force Development Officer: Trent Seely Main Desk: 506-658-2877