Download
1 / 24
240 likes | 364 Views
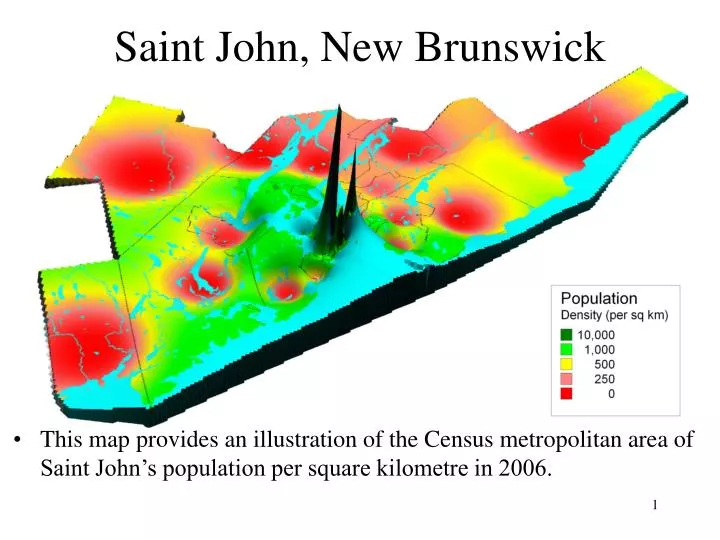
Saint John, New Brunswick. This map provides an illustration of the Census metropolitan area of Saint John’s population per square kilometre in 2006. 2006 Population. Five Census Metropolitan Areas (CMA) of similar size were chosen to compare with the CMA of Saint John.

E N D
Saint John, New Brunswick • This map provides an illustration of the Census metropolitan area of Saint John’s population per square kilometre in 2006.
2006 Population • Five Census Metropolitan Areas (CMA) of similar size were chosen to compare with the CMA of Saint John. • The population of the Census Metropolitan Area of Saint John declined by 0.2% between 2001 and 2006. • All of the other CMAs showed and increase in size.
Population by Age Group 2006 • The age demographic of Saint John fits within the average of the other communities examined. • Saint John has a higher percentage of children than Trois-Rivières and Thunder Bay and a higher percentage of seniors than Regina and Abbotsford.
Population by Age Group 2006 • These maps provide an insight into regions where higher percentages of children and seniors can be found within the CMA of Saint John.
Median Age 2006 • The median age in the CMA of Saint John is 40.5. • The median age of Saint John is similar to the median age of New Brunswick (41.5) but below the median age of Canada (36.0).
Population Change • Saint John had declined in population throughout all of the time periods examined.
Population Change by Age Group 2006 • Saint John CMA has shown a decline in the number of children and young adults. • Those between the age of 55 and 64 have shown the greatest increase in numbers.
Marital Status 2006 • In Saint John 54.1% of individuals over the age of 15 are legally married. • Trois-Rivières has the lowest percentage (38.8%) of people over the age of 15 that are legally married and not separated. • Abbotsford has the highest percentage (57,5%) of people over the age of 15 that are legally married.
Marital Status 2001 • Lutherans have the largest percentage (63.0%) of legally married individuals • Those who claim no religious affiliation have the largest percentage (45.4%) of never married individuals.
Household Size 2001 • Saint John has almost six out of ten households (58.7%) that have only one or two members. • Households in Trois-Rivières tend to be smaller. • Households in Abbotsford tend to be larger than households in the other communities examined.
Children Living at Home 2001 • 72% of children living at home in the Saint John are under the age of 18. In Canada 73% of children living at home are under the age of 18. • In Saint John 28% of adult children still live at home.
Housing 2006 • 60.3% of homes in Saint John are single family detached homes. • In the New Brunswick 71.1% of homes are single family detached homes. • 45.9% of households Trois-Rivières live in single family detached homes.
Income 2001 • Household income in the Saint John is higher than the household income of New Brunswick. • The incidence of low income in Saint John is higher than all of the other regions. • At 12.5% New Brunswick’s unemployment rate is higher than all of the other regions.
Source of Income 2001 • 14.4% of the residents in Saint John receive income through transfer payments. By comparison, 10.9% of residents in Regina receive income through transfer payments and 17.3% of residents in New Brunswick receive income from transfer payments.
Education 2001 • 58% of the population of Saint John have more than high school graduation. • In the Regina 64% of the population have more than high school graduation while in New Brunswick 52% of the residents have more than high school graduation.
Visible Minorities 2001 • 2.5% of the residents of Saint John belong to a visible minority. • In the Abbotsford 15.1% of residents belong to a visible minority. • 1.3% of the residents of New Brunswick belong to a visible minority.
Visible Minorities 2001 • None of the Lutherans in Saint John belong to a visible minority. • 47.3% of non Christian residents belong to a visible minority. • 5.3% of those who have no religious affiliation belong to a visible minority.
Immigration 2001 • 4% of the residents of Saint John’s population are immigrants. • Between 1996 and 2001 520 immigrants settled in Saint John. This is 0.4% of the population. • Between 2001 and 2006 Canada welcomed 1,200,114 immigrants. In 2006 new immigrants made up 3.9% of the Canadian population.
Immigration 2001 • 57% of Lutherans in Saint John are immigrants. • Between 1996 and 2001 10 Lutheran immigrants settled in Saint John. • 58% of non Christians in Saint John are immigrants • In Saint John 14% of those who claim no religious affiliation are immigrants.
Religious Affiliation - 2001 • Lutherans made up 0.2% of the population of Saint John in 2001. • 0.2% of residents in New Brunswick are Lutheran. • 10% of residents in Saint John claim no religious affiliation.
Religious Affiliation - 2001 • The map below shows the regions of Saint John where those who have no religion reside. • Non Christian and No Religion make up 23.8% of the population in Saint John. • Almost one quarter (23.6%) of Canadians and almost one tenth (9.0%) of residents of New Brunswick are Non Christian or have No Religion.
New Brunswick • In 2001 1,510 individuals in New Brunswick claimed to be Lutheran. Between 1991 and 2001 the number of Lutherans has declined by 4.1%.
Saint John, New Brunswick • In 2001 265 individuals in Saint John claimed to be Lutheran. Between 1991 and 2001 the number of Lutherans has declined by 19.7%.
Moncton, New Brunswick • In 2001 200 individuals in Moncton claimed to be Lutheran. Between 1991 and 2001 the number of Lutherans has declined by 9.1%.