Download
1 / 25
260 likes | 415 Views
Gene Expression Levels Are a Target of Recent Natural Selection in the Human Genome. Journal Club 021809. Mol. Biol. Evol. 26(3):649–658. 2009. Cis-regulation. Mutations in cis-regulatory regions changes gene function by changing the expression, timing, or location of gene expression

E N D
Gene Expression Levels Are a Target of Recent Natural Selection in the Human Genome Journal Club 021809 Mol. Biol. Evol. 26(3):649–658. 2009
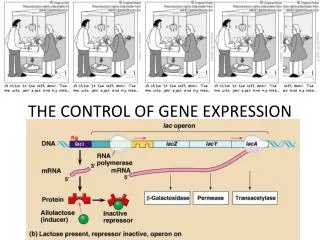
Cis-regulation • Mutations in cis-regulatory regions changes gene function by changing the expression, timing, or location of gene expression • Changes in cis-regulation are an important mode of adaptive evolution (Wray[2007]; Hoekstra and Coyne [2007])
Examples in Humans • Mutations upstream of the lactase gene that cause lactase production in the intestine to persist into adulthood (Tishkoff et al. 2007) • The Duffy-null mutation that stops expression of the DARC receptor in erythrocytes as a defense against Plasmodium vivax (Hamblin and Di Rienzo 2000) • Selection on cis regulation of human prodynorphin (Rockman et al. 2005) • Selection on regulatory variation at the human factor VII locus (Hahn et al. 2004) • Rapid evolution of either conserved noncoding sequences or promoter regions (Haygood et al. 2007; Kimand Pritchard 2007)
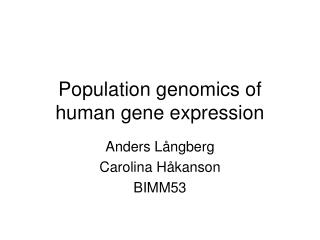
Expression Quantitative Trait Locus (eQTL) Mapping • To identify large numbers of SNPs that are strongly associated with gene expression levels, using data from the HapMap lymphoblast cell lines (Morley et al. 2004; Dixon et al. 2007; Stranger, Forrest, et al. 2007; Stranger, Nica, et al. 2007; Gilad et al. 2008; Veyrieras et al. 2008) SNPs (eQTLs) Gene expression levels
Hypotheses • If eQTLs are rarely targets of positive selection, then eQTLs should be independent of selection signals. • If expression changes that can be detected in lymphoblast cell lines are frequently adaptive, then there should be an enrichment for eQTLs among SNPs that show evidence of positive selection To test whether such eQTL signals are frequent targets of positive selection
Materials & Methods I • Hapmap Phase II (autosome SNPs with <20% missing data): CEU(60); YRI(60); ASN(90) • Ancestral states for all SNPs were estimated using whole-genome human–chimpanzee alignments • Excluded SNPs: -- without an estimated ancestral state -- whose population minor allele frequency <5% -- are close to chromosome ends or large regions without SNPs CEU: 2,143,201; YRI: 2,383,208; ASN: 1,966,892
Materials & Methods II • Gene expression data: Hapmap set – simple LR association analysis • Gene annotation of Illumina probes was obtained from the RefSeq database (Pruitt et al. 2007) 19,536 probes in 16,155 unique autosomal genes
Integrated Haplotype Score (iHS)-- Voight et al. 2006 • To detect signatures of strong, very recent, natural selection in favor of SNP alleles that have not yet reached fixation • By comparing the extent of haplotype homozygosity on haplotypes carrying the ancestral and derived alleles (SNPs) -- the presence of an unusual difference in homozygosity between the two alleles can be an indicator of selection Strong selection drives new alleles up to intermediate frequency
Why iHS? • Linkage disequilibrium among genetic markers does not degrade continuously with distance • high levels of linkage disequilibrium & low haplotype diversity region low levels of linkage disequilibrium & high haplotype diversities region • These patterns are attributed to non-homogeneous recombination, mutation, population history, random effects and natural selection
Why iHS? • Under neutral evolution, new variants require a long time to reach high frequency in the population, and LD around the variants will decay substantially during this period owing to recombination (BGC). • As a result, common alleles will typically be old and will have only short-range LD. • Rare alleles may be either young or old and thus may have long- or short range LD • Positive selection causes an unusually rapid rise in allele frequency, occurring over a short enough time that recombination does not substantially break down the haplotype on which the selected mutation occurs Nature 419, 832-837 (October 2002)
Why iHS? • Extended Haplotype Homozygosity (EHH): how LD breaks down with increasing distance to a specified core region – EHH at a distance x from the core region is defined as the probability that two randomly chosen chromosomes carrying a tested core haplotype are homozygous at all SNPs for the entire interval from the core region to the distance x EHH=0: all extended haplotypes are different EHH=1: all extended haplotypes are the same
R C Under neutral: LD C Common Old LD Old or Young Rare Under selection: LD Common Young
iHS iHH: integrated EHH A: ancestral, D: derived If <<0: unusually long haplotypes carrying the derived allele If >>0: long haplotypes carrying the ancestral allele Standardized expectation and standard deviation are estimated from the genome-wide empirical distribution, so iHS signals from different SNPs are directly comparable regardless of the allele frequencies at those SNPs
The discrepancy in the overall areas spanned by these two curves forms the basis of iHS
Criteria for SNP selection signals • |iHS| > 2 • With in “clusters”: • the proportion of SNPs within this window for which |iHS| > 2 and considered the window to be of interest if this proportion lies within the top 5% of all windows genome-wide for that population 75 75
Odds Ratio • The odds ratio that an SNP with a selection signal (|iHS| > 2 and a cluster-based signal in the top 5%) is an eQTL, compared with a comparable SNP without a selection signal • Two ways to estimate OR: 1. Logistic regression model 2. Bayesian hierarchical model
Logistic Regression Model • I(eQTL = 1): an indicator function:1 if an SNP is significantly associated with expression for the gene in question (at P<10-4) • I(iHSsig = 1): an indicator function:1 if the SNP shows signals of • selection • LD: a measure of the extent of LD around the SNP in question: the number of SNPs in high LD with the SNP in question (r2 > 0.8) • distTSS and distTES are the distances to the gene’s transcription • start and end sites, respectively • MAF: the minor allele frequency of the SNP in the relevant population • Logit[x] is the function log[Pr(x)/Pr(1 - x)]. • The β variables are the coefficients of the logistic regression. If β1 = 0: an enrichmentfor eQTLs among SNPs with selection signals
Red: |iHS| > 2 & cluster Blue: |iHS| > 2 Black: all Enrichment for eQTL v.s. TSS YRI
Enrichment for eQTL v.s. MAF Enrichment for eQTL v.s. LD
Bayesian Hierarchical Model • The ratio of the probability of the expression data assuming that the genotype at this SNP affects expression levels to the probability of the expression data assuming that the genotype does not affect expression levels • To predict whether a SNP will be an eQTL
Selection signals & diseases • Identified several genes that are involved in susceptibility to diseases: • alleles associated with lower expression of PPARG show signals of positive selection. • A common nonsynonymous variant in PPARG contributes to risk for type 2 diabetes • USF1 (hyperlidemia) • NF1 (neurofibromatosis) • RNF135 (overgrowth and learning disabilities) • GDF5 (height) But not always consistent with expression association data
Mechanisms of gene conversion Nature Reviews Genetics 8, 762-775 (October 2007)