Download
1 / 36
360 likes | 368 Views
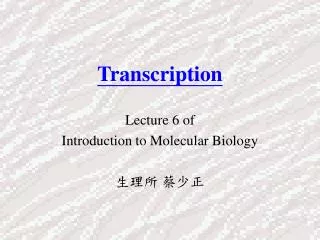
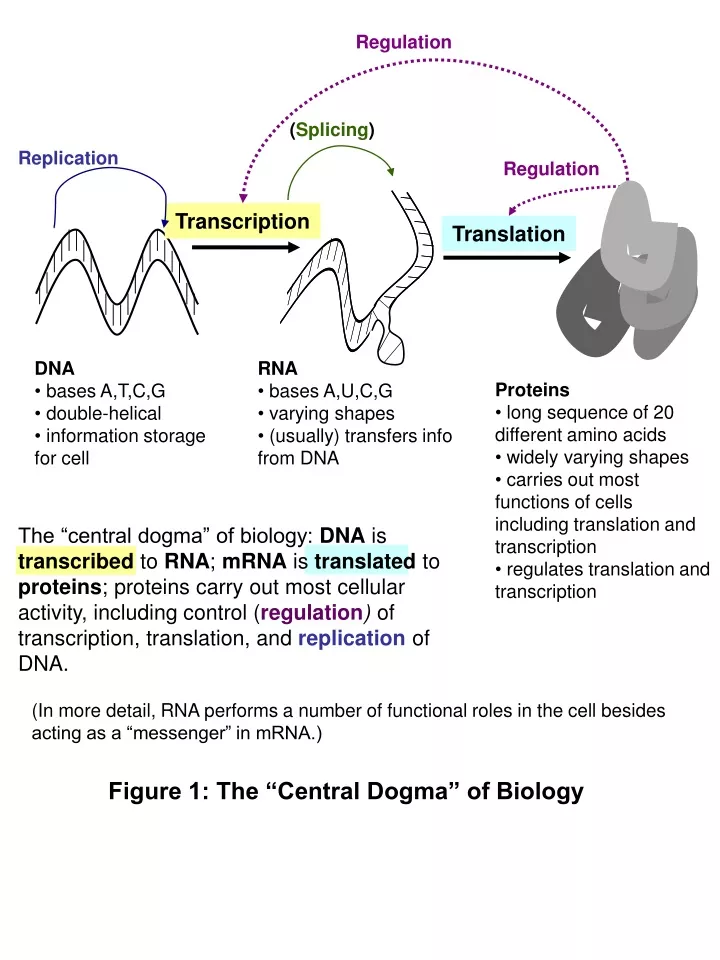
Regulation. ( Splicing ). Regulation. Replication. Transcription. Translation. DNA bases A,T,C,G double-helical information storage for cell. RNA bases A,U,C,G varying shapes (usually) transfers info from DNA. Proteins long sequence of 20 different amino acids

E N D
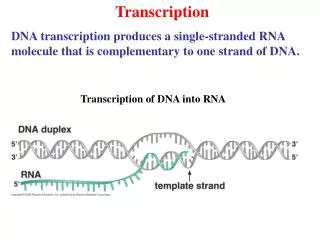
Regulation (Splicing) Regulation Replication Transcription Translation • DNA • bases A,T,C,G • double-helical • information storage for cell • RNA • bases A,U,C,G • varying shapes • (usually) transfers info from DNA • Proteins • long sequence of 20 different amino acids • widely varying shapes • carries out most functions of cells including translation and transcription • regulates translation and transcription The “central dogma” of biology: DNA is transcribed to RNA; mRNA is translated to proteins; proteins carry out most cellular activity, including control (regulation) of transcription, translation, and replication of DNA. (In more detail, RNA performs a number of functional roles in the cell besides acting as a “messenger” in mRNA.) Figure 1: The “Central Dogma” of Biology
sperm whale 101 meter human 100 approximate range of resolution of a light microscope hamster 10-1 cm 10-2 mm 10-3 approximate range of resolution of an electron microscope C. Elegans (nematode) 10-4 amoeba most eukaryotic cells S. cerevisiae (yeast) 10-5 μm most prokaryotes E .coli 10-6 mitochondrion 10-7 most viruses ribosome 10-8 protein nm 10-9 amino acid 10-10 hydrogen atom Figure 2: Relative Sizes of Various Biological Objects
Bound ribosomes Smooth endoplasmic reticulum Rough endoplasmic reticulum Lysosomes Nucleolus Nuclear envelope Microfilaments Free ribosomes Nucleus Centrosome Endosome Mitochondria Golgi complex Microtubules Vesicles Endosome Plasma membrane Cytosol (main part of cell) Figure 3: Internal Organization of a Eukaryotic Animal Cell
voltage! closed wait open inactive Na+ wait A voltage-gated ion channel with three states: closed, which opens in response to voltage; open, which allows ions to pass through; and inactive, which blocks ions, and does not respond to voltage. The open and inactive states are temporary. Figure 4: A Voltage-Gated Ion Channel
(i) (i) (ii) (ii) (iii) (iii) (iv) (iv) Na+ Na+ Na+ Figure 5: How Signals Propogate Along a Neuron (A) How a voltage signal travels down a neuron like a wave. First, a voltage signal hits channel (i), as shown in (A). (B) Then channel (i) opens, and ions rush in, causing a voltage spike that opens channel (ii), as shown in (B). (iv) (iii) (i) (ii) (C) Then channel (ii) opens, sending voltage spikes to channels (i) and (iii), as shown in (C). (i) (iii) (iv) (ii) (D) Next, channel (iii) opens, as shown in (D). Because (i) is inactive, it cannot open. Ion-produced voltage spikes are now sent to the inactive channel (ii) and the closed channel (iv). Channel (iv) will open next.
(A) vesicles with neurotransmitters ion channels sender receiver synaptic cleft Na+ Na+ (B) Na+ (C) Na+ Na+ An example of a transmitter-gated ion channel. (A) shows the initial state. A substance used for signaling (for neurons, this is called a neurotransmitter) is held in vesicles by the sender cell. (B) In response to some internal change, the neurotransmitter is released. (C) Some of the neurotransmitter binds to ion channels on the receiver cell, and causes the channels to open. Most of the remainder of the neurotransmitter is re-absorbed by the sender cell, in a process called re-uptake. A common neurotransmitter is serotonin (which is chemically related to the amino acid tryptophan). Many widely-used antidepressants (Prozac, Zoloft, and others) inhibit the reuptake step for serotonin, and are thus called selective serotonin re-uptake inhibitors (SSRIs). They cause serotonin to accumulate in the synaptic cleft, making it more likely that signals will propagate from cell to cell. Figure 6: A Transmitter-Gated Ion Channel
G-protein coupled receptor G (A) A G-protein complex is bound to the G-protein coupled receptor on the inside of the cell. (There are many different types of G-proteins, and many types of receptors.) ligand conformational change G (B) When the receptor binds to the ligand molecule, then the entire receptor changes shape. As a consequence, the G-protein complex is altered: part of it is released, to propagate the signal elsewhere in the cell. Figure 7: A G-Protein Coupled Receptor Protein
(A) A diploid cell, with one pair of homologous chromosomes. (B) After DNA replication the cell has a two pairs of sister chromatids. (C) The homologous chromatids pair to form a bivalent containing four chromatids. (E) Bivalents are separated in preparation for division I. (F) The cell divides. Each daughter has two copies of a single parent’s chromosome. (D) DNA fragments recombine. (H) The daughter cells divide, producing four haploid cells, each of which contains a single representative of each chromosome pair from the original diploid cell. (G) The sister chromatids in each daughter cell separate from each other in preparation for division II. (I) In sexual reproduction, two haploids fuse to form a diploid cell with two homologous copies of each chromosome – one from each parent. Shown here is a cell formed from one of the daughter cells in (H), and a second haploid cell from another parent. Figure 8: How Meiosis Produces Haploid Cells
L ring outer membrane P ring Rod MS ring MotA proteins inner membrane MotB proteins Structure of a bacterial flagellum (simplified). About 40 different proteins form this complex. The MS ring is made up of about 30 FliG subunits, and about 11 MotA/MotB protein pairs surround the MS ring. It is believed that these pairs, together with FliG, form an ion channel. As ions pass through the channel, conformational changes cause the MS ring to rotate, much like a waterwheel. A similar “molecular motor” is used in ATP synthesis in a mitochondrion: rotation, driven by ions flowing through a channel, is the energy used to convert ADP to ATP. (See the section below, “Energy and Pathways”). Figure 9: The Bacterial Flagellum (simplified)
competes The lacZ gene is transcribed only when CAP binds to the CAP binding site, and when the lac repressor protein does not bind to the lac operon site. promotes lac operaton lacZ gene CAP binding site expresses inhibits bindsTo bindsTo bindsTo CAP protein lac repressor protein proteins needed to import lactose RNA polymerase recruits bindsTo external lactose allactose increases external glucose bindsTo cAMP increases inhibits This network presents simplified view of why E.coli produces lactose-importing proteins only when lactose is present, and glucose is not. Figure 10: How E. coli responds to nutrients
P A B S ES E S C D EP E A cartoon showing how an enzyme catalyzes a change from S to P. (A) Initially, the enzyme E and “substrate” S are separate. (B) They then collide, and bind to form a “complex” ES. (C) While bound to E, forces on the substrate S cause it to change to form the “product” P. (D). The product is released, and the enzyme is ready to interact with another substrate molecule S. A chemist would summarize this as: E+S ES EP E+P Figure 11: How Enzymes Work
saturation linear growth Reaction velocity with a fixed quantity of an enzyme E, and varying amounts of substrate S. When little substrate is present, an enzyme E to catalyze the reaction is quickly found, so reaction velocity Vgrows linearly in substrate quantity [S]. For large amounts of substrate, availability of enzymes E becomes a bottleneck and velocity asymptotes at Vmax Figure 12: Saturation Kinetics for Enzymes
A Possible reactions are: B Notice that pES depends on the amount of ES, which changes over time. To simplify, assumeES has a “steady state” at which the amount of ES is constant. C and then solve result forpES D Figure 13: Derivation of Michaelis-Menten Kinetics (part 1/2)
Notation: Following the derivation in the previous figure… D Michaelis-Menten saturation kinetics F Now derive some limits… E The first limit shows that V, the velocity at which P is produced, will asymptote at Vmax. The second limit shows that for small concentrations of S, the velocity V will grow linearly with [S], at a rate of Vmax/kM. Figure 14: Derivation of Michaelis-Menten Kinetics (part 2/2)
fast slow Allosteric enzymes switch from a slow-binding state to a fast-binding state, and tend to remain in the fast-binding state when the substrate S is common. Their kinetics follows a sigmoid curve. empty non-empty fast- binding slow- binding A typical allosteric enzyme: when one half is being used, the whole molecule tends to shift to the fast-binding state. Figure 15: An Enzyme With a Sigmoidal Concentration-Velocity Curve
Q ATP E+P+ATP E+Q+ADP E E P ADP ADP Figure 16: A Coupled Reaction
... isocitrate NADH isocitrate dehydrogenase NAD+ α-ketoglutamarate + CoA-SH NADH α-ketoglutamarate dehydrogenase NAD+ succinyl-coA synthetase succinyl-CoA + Pi GTP GDP succinate E-FADH2 succinate dehydrogenase E-FAD fumarate ... Part of the TCA cycle (also called the citric acid cycle or the Krebs cycle) in action. A high-energy molecule of isocitrate has been converted to a lower-energy molecule called α-ketoglutamarate and then to a still lower-energy molecule, succinyl-CoA(as shown by the path taken by the green circle). In the process two low-energy NAD+ molecules have been converted to high-energy NADH molecules. Each “see-saw” is an enzyme (named in italics) that couples the two reactions. The next steps in the cycle will convert the succinyl-CoA to succinate and then fumarate, producing two more high-energy molecules, GTP and E-FADH2. Figure 17: Part of an Energy-Producing Pathway
light PDE PDE* R R* cGMP G+Pi T* T opens ion channel Figure 18: How Light is Detected by Rhodopsin
Number of molecules affected over time, assuming that each R* activates 100 transducin per second and each PDE hydrolyses 100 cGMP per second. (The actual numbers are larger). The number of hydrolyzed cGMP molecules grows rapidly—at a quadratic rate—because it is product of two stages of “linear amplification”. More stages of amplification would produce even steeper response curves. Figure 19: Amplification Rates of Two Biological Processes
It can be shown that if a particle is released at distance δ from the surface of a sphere of radius R, it will touch the sphere before diffusing away with probability p = R/(R+δ). (See the book by Berg, 1983, cited in the last section, equations 3.1-3.5.) If the particle hits the sphere, bounces off, and returns to distance δagain, it has another chance to hit the sphere, again with probability p, so the expected number of times n it hits the sphere before diffusing away is This means that a protein nearing a relatively large membrane-enclosed object (like a cell or organelle) is more likely to follow a path like the solid line than the dashed line—it will typically hit the cell many times before diffusing away, giving it many chances to “find” a receptor. Figure 20: Behavior of Particles Moving by Diffusion
(A2) (A3) θ2 θ1 (A1) (D) (C) lens (B) p’ p θMAX Abbe model of resolution: (A) Light passing through two pinholes propagates outward beyond the pinholes much as waves in water would (arcs in A1). Constructive interference between these waves (suggested by dotted lines) causes light to emerge only at certain angles (grey rays) called diffraction orders. A “perfect storm” for constructive interference of light with wavelength λ occurs when many pinholes are placed at a uniform distance p (A2); then the diffraction orders (A3) are at angles θ1,θ2,θ3,etc, such that p sin θN = Nλ Different spacings p,p’ between the pinhole will lead to different diffraction angles (B), (C). To get enough information to determine the separation between pinholes, a microscope needs to capture rays from at least two diffraction orders. The aperature (width) of the microscope limits the angle between these to some θMAXand solving the equation above implies p > λ/sin θMAX Unless this holds, the two pinholes cannot be resolved. Figure 21: The Abbe Model of Resolution
In phase Out of phase cell Light travels more slowly though the cell medium (water) Figure 22: How A Differential Interference Contrast (DIC) Microscope Works
(A) (B) (C) Reflected light (the dotted purple arrows) is filtered out filter lens Laser light (to excite fluorescence) Emitted light (dotted green arrows) is collected by the lens • A photon is absorbed (A), pushing an electron to a higher-energy orbit (B). • The atom remains in an excited state(B) for a short time. • The atom emits a photon when the electron returns to the low-energy orbit (C). The wavelength of the emitted light is different from the wavelength of the laser light, so the emitted light can be easily separated from reflected light by a filter. Figure 23: How A Fluorescent Microscope Works
Fluorescent microscope images. These cells are cultured human cells, in which one of the G-couple protein receptors for serotonin has been made fluorescent. Panel (A) shows control cells, in which the fluorescence is all at the surface of the cell. Panel (B) shows cells that have been incubated with dopamine, a neurotransmitter, for 10 minutes. After exposure to dopamine, some of the receptors have moved to the interior of the cell—which suggests that the cell will be harder to stimulate with serotonin. Panels C-F show cells at various times after the dopamine has been removed: 1 hour, 1.5 hours, 2 hours, and 2.5 hours. After 2.5 hours, most of the receptors have once more moved to the surface of the cells. From “Activation, internalization, and recycling of the serotonin 2A receptor by dopamine”, by Samarjit Bhattacharyya, Ishier Raote, Aditi Bhattacharya, Ricardo Miledi, and Mitradas M. Panicker, PNAS, 2006;volume 103; pp. 15248-15253. Figure 24: Fluorescent Microscope Images
F E Electron microscope images. (A) human HeLa cells (B) the inset in (A), further magnified. (C) hamster CHO cells, with some mitochondria shown in the inset. (D) actin filiments. (E) part of the intestinal cell of a 4-day old rat. (F) the vesicle indicated with an arrow in (E). Scale bars are 1 micrometer in E, 100 nm in F. Figure 25: Electron Microscope Images
Consumer-Class Personal Computers Contain Three Main Subassemblies We took a collection of 1200 consumer-class PCs (Dell Dimension 4700) and spread them evenly on a 20m x 20m area of deep-pile shag carpet, using a Caterpillar 657 road scraper. We next drove over the carpet with a ¾ Chevrolet pickup truck for 15minutes to completely fragment the outer cases of the PCs, and then blasted the fragments with the exhaust from three GE90 turbofan engines for 30min. The interaction of the airflow and the deep-pile carpet separated the PC components into three clear bands, as is shown in the aerial photograph (Fig. 1, after digitally sharpening the image.) OC MB PS Fig. 1. Dell PCs, after fragmentation and dispersal with turbo-fan generated air currents. Subsequent analysis with electromagnets showed that the uppermost band is almost completely non-ferrous, and lighter in color. We conjecture it to be comprised of fragments of the outer case of the PCs. The remaining two bands we will call the MB band and the PS band. … Figure 26: An Article on Reverse Engineering PCs, Written by Giants
An example of an SDS-PAGE gel. Lanes 1-3 are a complex mixture of several substances, and lanes 4-6 show the corresponding mixture components after purification (via Western blotting, described below). The leftmost column is provided by the authors, and shows the molecular weights of substances that migrate to each level. Here the authors are demonstrating the effectiveness of the purification method used. From Mass spectrometric analysis of electrophoretically separated allergens and proteases in grass pollen diffusates, by Mark J Raftery , Rohit G Saldanha , Carolyn L Geczy and Rakesh K Kumar, Respiratory Research 2003, 4:10 Figure 27. Using SDS-PAGE to separate components of a mixture
new bond H H O N terminus amino group C terminus carboxyl group C C H2N C HN COOH “side chain” group H20 “side chain” group R1 R2 A protein, which is a chain of amino acids, has an N-terminus (where there is an unlinked nitrogen-containing amino group) and a C-terminus (with an unlinked carbon-containing carboxyl group). Figure 28. Structure and nomenclature of protein molecules
(A) p protein B protein A DBD TAD q promoter for gene x gene x (A) In wild yeast, A binds B, which activates gene x. Only the DNA binding domain (DBD) is needed for A to find the promoter site, and only the transcription activation domain (TAD) is needed for B to activate transcription. (B) protein A1p protein B1q (bait) (prey) DBD TAD promoter for gene x gene y (reporter gene) (B) In hybridyeast, the DNA has a promoter for x near a reporter gene y. A1p can bind to the promoter site using the DBD of A, and B1q will activate transcription—of gene y—using the TAD of x. But A1p will only recruit B1q if proteins p and q bind. So, y is expressed iff p and qbind. Figure 29. The yeast two-hybrid system
to “previous” nucleotide’s 3’ atom phospho- diester linking group base carbon atoms 5’ O sugar 4’ 1’ 3’ 2’ carbon atoms prospho- diester linking group to “next” nucleotide’s 5’ atom A nucleoside consists of a nucleobase (e.g., adenosine, thymine, cytosine, guanine) and a sugar group—ribose for RNA, and deoxyribose for DNA.Normally sugars are linear atoms, and the carbon atoms are numbered 1,2,3,4,5. In nucleic acids they fold into a ring, but the atoms are numbered in the same order; however, they are labeled 1’,2’,3’,4’,5’ to distinguish them from the carbon atoms on the ring associated with the nucleobase (which are labeled 1,2,3,4,5,6). A nucleotide is a nucleoside plus a phosphate group, which links it to the next nucleotide in the polymer. The phosphate groups link the 3’ atom in one nucleotide to the 5’ atom in the next. By convention, DNA strands are usually written with the “5’ end” (the end with a “dangling” 5’ carbon, not attached to any nucleotide) to the left. Figure 30: Structure and nomenclature of DNA molecules
(A) DNA replication in vivo strand lagging Origin of replication direction of replication leading strand (B) DNA replication in vitro using PCR Single-stranded template DNA Single-stranded primer Replicated DNA Figure 31: DNA duplication in nature and with PCR
(B) Gel with one lane for each output (A) Possible outputs of four “buggy” DNA-copying procedures Sanger method for sequencing DNA. (A) The result of using variants of a DNA-copying procedure on many copies of a single strand of DNA. The variants randomly stop at prefixes that end in “A”, “T”, “C”, and “G”, respectively. The result of this is four populations of prefixes of the unknown DNA strand. (B) Using a gel to separate the four populations by weight. From the gel, the length-7 prefixes end in “A”, the length-6 prefixes end in “C”, and so on. Hence the final string can be reconstructed as “GATTACA”. Figure 32. Procedure for sequencing DNA
marker DNA containing binding site for FokI (A) (B) RE cDNA DNA ligase (C) FokI RE (D) amplifiable fragment with ditag tag + marker A The process used in SAGE for “summarizing” cDNA. (A) A RE is used to randomly cut cDNA that is bound to a strepavidin bead. (B) Marker DNA fragments (lavendar boxes) are ligated to the ends of the remaining cDNA fragments. (C) The RE FokI is added. FokI binds to a site in the marker DNA, and cuts 20bp downstream of the binding site. Each cut releases a fragmentof DNA containing the marker and a small part of the original cDNA, called a tag. (D) Two populations of marker-tagfragments, with different markers, are mixed and ligated together. PCR can be used to amplify those cDNA fragments containing both markers, which must also contain at least two tags. These ditag-containing DNAs are then sequenced, revealing the sequence of the 20bp tags snipped off by the FokI RE. tag + marker B Figure 33. Serial analysis of gene expression (SAGE)
w a l t c h e n --------------------------- w| 0 1 2 3 4 5 6 7 8 i| 1 1 2 3 4 5 6 7 8 l| 2 2 1 2 3 4 5 6 7 l| 3 3 2 2 3 4 5 6 7 | 4 4 3 3 2 3 4 5 6 c| 5 5 4 4 3 2 3 4 5 o| 6 6 5 5 4 3 3 4 5 h| 7 7 6 6 5 4 3 4 5 e| 8 8 7 7 6 5 4 3 4 n| 9 9 8 8 7 6 5 4 3 An example of how to compute the Levenshtein distance between two strings. The i,j-th element of the matrix stores distance(Q,T,i,j), and the value of the lower right-hand corner entry (i.e., 3) is the distance between the two strings. The shaded entries are those that were used in the computation of the minimal cost (i.e., the cases of the min computation that were used to find the final score). Figure 34. Computing a simple edit distance
w i l l w a l t c h e n c o m e --------------------------------------------------------- w| 2 1 0 0 0 2 1 0 0 0 0 0 0 0 0 0 0 0 0 i| 1 4 3 2 1 1 1 0 0 0 0 0 0 0 0 0 0 0 0 l| 0 3 6 5 4 3 2 3 2 1 0 0 0 0 0 0 0 0 0 l| 0 2 5 8 7 6 5 4 3 2 1 0 0 0 0 0 0 0 0 | 0 1 4 7 10 9 8 7 6 5 4 3 2 1 2 1 0 0 0 c| 0 0 3 6 9 9 8 7 6 5 7 6 5 4 3 4 3 2 1 o| 0 0 2 5 8 8 8 7 6 5 6 6 5 4 3 3 6 5 4 h| 0 0 1 4 7 7 7 7 6 5 5 8 7 6 5 4 5 5 4 e| 0 0 0 3 6 6 6 6 6 5 4 7 10 9 8 7 6 5 7 n| 0 0 0 2 5 5 5 5 5 5 4 6 9 12 11 10 9 8 7 Computing the Smith-Waterman similarity between two strings. The largest element of the matrix (i.e., 12) is the similarity. The long shaded area is associated with the score 12, and the substrings “will cohen” and “walt chen”. The other shaded areas correspond to an exact match of the substring “will_” (with a score of 10) and an approximate match of “_cohe“ to “_come” (with a score of 7). Figure 35. The Smith-Waterman edit distance method
(A) (B) Human Human Mouse Shark Mouse Bird Shark Bird Figure 36. Two possible evolutionary trees