Download
1 / 32
320 likes | 640 Views
The Sharjah-Stanford VLF Workshop Applied Physics Department, College of Sciences University of Sharjah, Sharjah, UAE 22-24 February 2010. Ionosphere Scintillation and Earthquakes. Rafik A. Kandalyan, & Mohammad Kh. AlQuran Institute of Astronomy and Space Sciences (IASS),

E N D
The Sharjah-Stanford VLF Workshop Applied Physics Department, College of Sciences University of Sharjah, Sharjah, UAE 22-24 February 2010 Ionosphere Scintillation and Earthquakes Rafik A. Kandalyan, & Mohammad Kh. AlQuran Institute of Astronomy and Space Sciences (IASS), Al al-Bayt University (AABU) Mafraq, Jordan
Institute of Astronomy & Space Science Rafik Kandalyan (kandalyan@yahoo.com) Al al-Bayt University Jordan Mohammad Quran (mohdquran@yahoo.com) Hanna A. Sabat (sabat@aabu.edu.jo)
Introduction • There are many indications that can be observed before an earthquake strikes, which are called precursors.
Previous Studies • The critical frequency for F2 layer data are analyzed with upper and lower bound of inter-quartile range (IQR) and the observed anomalous changes related to geomagnetic disturbances (Dabas, R.S. et al, 2007).
The results of the study show some unusual perturbations observed in critical frequency F2 region, 1–25 days before and 2–3 days after the main shock.
In this research, the ionosphere scintillation index S4 is thoroughly examined to determine the relationship between the scintillation and occurrence of seismic activities. • The GPS observations were carried out at a frequency 1.575 GHz.
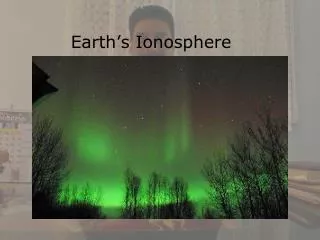
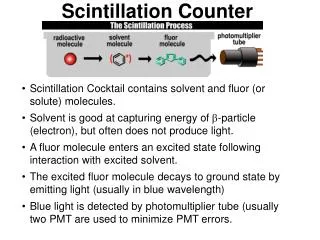
Scintillation • Ionosphere scintillation occurs when artificial (satellite) or natural signals propagate through an irregularity layer in the ionosphere.
The signal fluctuation varies widely with frequency, geomagnetic, solar activity. F2 (200 – 450 km, Ne ~ 106 cm-3 , critical frequency ~ 9 MHz) layer is the most important layer for scintillation.
The S4 index is a statistical parameter namely the standard deviation of the received power of the signal coming from GPS satellite passing through the ionosphere normalized by its mean value.
It is the most commonly used parameter for indicating the intensity variation (Briggs and Parkins, 1963). * Where P is the received power of the signal.
S4 and phase are statistical variables computed over a “reasonable time” period that satisfies good statistics.
S4 and σφ(phase variation)depend on the density fluctuation in the medium.
Where f is the frequency of observation. (Rino, 1979, Phase screen theory).
Earthquakes • The severity of earthquake can be described according to Dobrovolsky et all (1979) empirical formula: • Where R is the radius of the zone of the earthquake; M is the earthquake’s magnitude.
Data and Results • For data collection the following steps were completed. 1. We determine the coordinates (longitude/ latitude) of the GPS receiver's location.
2. We collect information of earthquakes within a circular region with a radius of about 7000 km, its median point being the GPS receiver, using Earthquake Hazard Program (http://neic.usgs.gov/neis/epic_circ.html ). The lower limit of earthquake's magnitude M=6 is adopted.
3. Upon selection of the earthquake that affects the GPS receiver we compare the distance between the earthquake's center and the location of the GPS receiver. We have estimated the radius of the region affected by the earthquake using the Dobrovolsky et al. (1979) formula.
When both distances were comparable, we include that earthquake in our analysis. • Following such procedure just few earthquakes were selected and Table 1 shows their characteristics.
S4 index data are available from GPS Scintillation Data in an Indonesian website which belongs to Solar-Terrestrial Environment Laboratory/ Nagoya University (http://stdb2.stelab.nagoya-u.ac.jp/QL-S4/data.html ).
Additional data are available from the website that belongs to Bear Lake Observatory/ Utah State University (http://www.spacenv.com/~rice/BLO/s4/S4/index.html ). • The S4 > 0.5 is selected as a severity of scintillations index.
The relationships between scintillation S4 indices (left axis), earthquake magnitude (right axis) and time for Indonesia earthquakes at 22/02/2004, 11/05/2004 and 25/07/2004 are presented in Fig.1.
Figure 1. The relationship between the number of severe scintillations (left axis) represented by circle and the magnitude of an earthquake (right axis) represented by square. The results for Indonesia earthquakes on 22/2/2004 and 11/5/2004 and 25/7/2004, are presented.
Fig. 2 shows the same relationships for Utah earthquake. The tight correlation between the occurrence of earthquakes and severity of ionosphere scintillation is evident.
Figure 2. The relationship between the number of severe scintillations (left axis) represented by circle and the magnitude of an earthquake (right axis) represented by square, shown are the results for Utah State earthquake on 15/6/2005.
From Figs.1 & 2, we can see that the daily number of occurrence for severe scintillations begins to increase approximately two weeks before the main shock, as well as a few days after. This is due to the fact that there are pre-seismic activities preceding the earthquake.
Discussion The ionosphere is not strictly uniform, but contains irregularities of different sizes. The effects of these irregularities on the propagation of radio waves may be treated by diffraction theory. As a wave travels through an irregular medium it will accumulate changes of amplitude and phase.
The motion of electrons in the ionosphere is controlled by the Earth’s magnetic field. Therefore, any variation of the geomagnetic field may stimulate variation of electron density. Thermally driven convection in the Earth's core bends and twists magnetic field lines which lead to an electric current and large magnetic fields.
Conclusion • The results of this work indicate that there is a tight correlation between the occurrence of a strong earthquake and ionosphere scintillation. • The S4 index can be a promising factor in predicting earthquakes. This is due to the fact that there is an obvious increase in the S4 index up to two weeks preceding an earthquake.
Some Future Prospects • Performing similar studies using the KP index and comparing it to this study. • Using natural radio sources like radio-galaxies and quasars to analyze ionosphere scintillation, instead of artificial signals.
References Briggs, B.H. and Parkin, I.A., J.Atmos. Terr. Phys., 25, 339, 1963. Dabas, R.S. et al, JASTP, 69, 1813, 2007. Dobrovolsky, I.R., et al, Pure and Applied Geophysics, 117, 1025, 1979. Rino,C.L., Radio Sci., 6, 1135,1979.