Download
1 / 22
350 likes | 657 Views
Box Plots and Outliers. Box Plot. We need 5 numbers, called the 5 number summary: 1. minimum value 2. Q1 3. median 4. Q3 5. maximum value. Harry Potter Data. The 5 number summary is: Minimum 70.9 Q1 78.9 Median 81.35

E N D
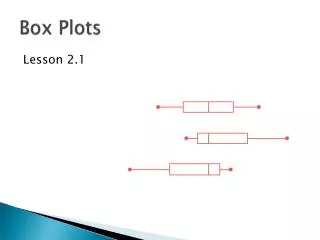
Box Plot We need 5 numbers, called the 5 number summary: 1. minimum value 2. Q1 3. median 4. Q3 5. maximum value
Harry Potter Data The 5 number summary is: Minimum 70.9 Q1 78.9 Median 81.35 Q3 84.45 Maximum 86.2
Drawing the plot free hand • Use a scaled line to draw the box plot • Approximate locations of the values. • We say this is SKEWED LEFT since the longer tail is on the left side.
Using the TI • Put the data into the list • Press y = ; make sure that there is nothing in the 10 equations
Press 2nd key, y = • There are 3 statistical plots. • Press #1
Turn the plot ON • Select the 2nd box plot • Make the x list L1
Press Zoom • Press Enter on #9
Press TRACE to see values; use right or left arrow keys to move around.
Inter-quartile Range • The inter-quartile range (IQR) is the value of Q3 – Q1
Outliers • An outlier is an unusual score, relative to the data set. It will influence the mean and the standard deviation. • A data set might have no outliers, one outlier, or several outliers. • Two types: Mild and Extreme
Mild Outliers Look for data values (x) that are either: 1. 2.
Extreme Outliers Look for values that are either: 1. 2.
Example: Ages of actresses at the time they first won the Oscar
5 number summary for actresses • Min = 21 • Q1 = 30 • Med = 34 • Q3 = 41 • Max = 80
Actresses • Check for outliers. Identify type.
Box plot with outliers • When we select the 1st box plot on the TI, it allows us to see outliers. Select the mark that is visible for you.
Trace and go to the right twice. • The 50 is the last data value that is not an outlier.