Download

1 / 10
100 likes | 278 Views
Box Plots (Box and Whisker). By: Zane Gouda, Garrett Miades , Zack Brown, and Dillon Garrett. What is a Box plot?.

E N D
Box Plots(Box and Whisker) By: Zane Gouda, Garrett Miades, Zack Brown, and Dillon Garrett
What is a Box plot? • Definition-A box plot is a plot in which a rectangle represents multiple sets of data. In a box and whisker plot, the ends of it show the minimum and maximum data, the start of the box shows the first quartile (Lower Quartile), the line in the middle of the box shows the median, and the end of the box shows the third quartile (Upper Quartile).
What are the parts of a box plot? • Lower Endpoint- The lowest number in the set of data • Upper Endpoint- The highest number in the set of data • Median- The middle number in the set of data • Upper Quartile- The number that represents the median of the larger half of data in the set • Lower Quartile- The number that represents the median of the lower half of data in the set • Inter Quartile Range- The distance between the lower quartile and the upper quartile.
How to make a box plot • To make a box plot, you need a single set of numerical data with no frequencies • First, you need to put the data from least to greatest • Second, you need to find the median, upper quartile, lower quartile, lowest number in the data set, and highest number in the data set. • Third, you need to make a number line that will include all of the data • Fourth. You need to make vertical lines where the upper and lower quartiles are, and where the median is and connect them to make a box • Finally, make a line out from each of the quartiles, extending to the highest and lowest point in the data, depending on what quartile you make the line on.
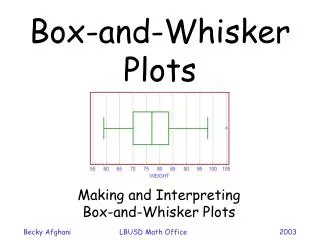
Example? Upper Endpoint Lower Endpoint Lower Quartile Upper Quartile Median This plot shows the time that boys and girls spend on social networks a day. This is also an example of a real life situation. To make this graph, we need a single set of numerical data.
Quiz Question Make a box plot from the following data (Last MP Grades in our class): 90,97,83,86,91,84,88,95,92,96,88,85,99,91,94,95,91,98,95,89,93,90,95,94,87,91 Please also right down the: • Upper Quartile • Lower Quartile • Median • Interquartile Range
Answer Math Grades in Our Class Upper Quartile: 95 Lower Quartile: 88 Median: 91 Interquartile Range: 7
Advantages • The box and whisker plot is good because it allows you to see the important part of the data without showing all of the numbers. • Another advantage of the box and whisker plot is that it is easier to compare 2 sets of data if both box and whisker plots are on the same graph • It is clear and easy to see the data points, since the plot is so close to the number line
Disadvantages • The actual data is not shown at all in the number line. • The graph does not show the mean and the mode, which also cannot be depicted from the graph.
Works cited • Shmoop.com: www,shmoop.com/basic-statistics-probability/box-whisker-plots-examples-2.html • NMSU: mc2.nmsu.edu/mathnm/investigation1_wisker.html • TutorVista.com: math.tutorvista.com/statistics/box-and-whisker-plot.html


![[12-2B] Box & Whisker Plots](https://cdn3.slideserve.com/6306071/slide1-dt.jpg)