Download
1 / 15
150 likes | 217 Views
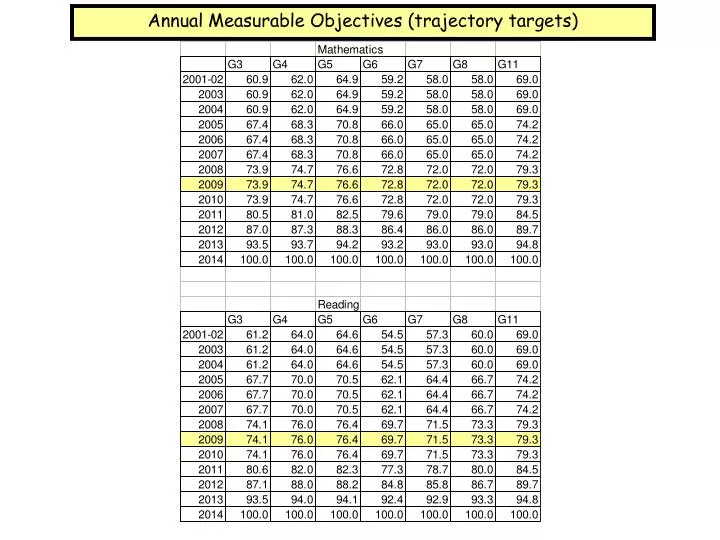
Annual Measurable Objectives (trajectory targets). See your superintendent. Enter District Name and select Certification for Adequate Yearly Progress status. Select Display and District tab to access the district data (see next slide).

E N D
Enter District Name and select Certification for Adequate Yearly Progress status
Select Display and District tab to access the district data (see next slide)
Select Display and a Building tab to access building data (see next slide)
Building data is collapsed by the grade spans within a building. For example: 3-5 3-6 6-8 7-8 and 11 All students for participation Full Academic Year (FAY) only students for assessment
Focus on the proficiency of students who have been in the district or a building for a Full Academic Year (FAY)
2. Grade Configuration Focus on the proficiency of students who have been in the district or a building for a Full Academic Year (FAY) 1. Building Name 5. Total FAY Students 7. Met or Missed AYP 3. Number Proficient (including IAA) 4. Additional Meeting Growth 6. Percent Proficient
> 41 NPR 31-40 NPR* 10-30 NPR* 1-9 NPR Definition of Adequate Yearly Growth: The improvement (growth) that current non-proficient students are expected to make from one year to the next is depicted in the graph above. This plot shows the category boundaries for non-proficient students across grades.
> 41 NPR 31-40 NPR* 10-30 NPR* 1-9 NPR * The High Marginal region contains the scale score points that are within one standard error of measurement below the cut score for Proficient. The Lo Marginal region is the remaining part of the Marginal region. So…. 10-30 NPR and 31-40 NPR are estimations used here for explanation. Accurate calculations are grade level/scale score specific. Refer to the NCLB Growth Model Plan on the DE website for actual scale score ranges.
> 41 NPR 31-40 NPR* 10-30 NPR* 1-9 NPR This growth model is motivated by two guiding principles. First, Adequate Yearly Growth must be greater than expected growth in order to ensure that students are on track to proficiency. Second, growth trajectories must be maintained over time in order to be considered adequate. A student only makes AYG if that student attains a higher and previously unattained level of achievement. A particular student may only count for AYG a maximum of two times.
Confidence Interval: • Multiple the school’s % proficient by the school’s % non-proficient • Divide the result by the average number of students for the biennium period. • Take the square root of your result. • Multiply that by 2.054 • If you add this to your percent proficient, and it is equal to or greater than the state’s target, you’re OK. • If you subtract this from the state’s target, and the result is less than your percent proficient, you’re OK.