Download
1 / 34
340 likes | 440 Views
Appalachian Lee Troughs and their Association with Severe Thunderstorms. Daniel B. Thompson, Lance F. Bosart and Daniel Keyser Department of Atmospheric and Environmental Sciences University at Albany/SUNY, Albany, NY 12222 Thomas A. Wasula NOAA/NWS, Albany, NY Matthew Kramar

E N D
Appalachian Lee Troughs and their Association with Severe Thunderstorms Daniel B. Thompson, Lance F. Bosart and Daniel Keyser Department of Atmospheric and Environmental Sciences University at Albany/SUNY, Albany, NY 12222 Thomas A. Wasula NOAA/NWS, Albany, NY Matthew Kramar NOAA/NWS, Sterling, VA 37th Northeastern Storm Conference, Rutland, VT 3 Mar 2012 NOAA/CSTAR Award # NA01NWS4680002
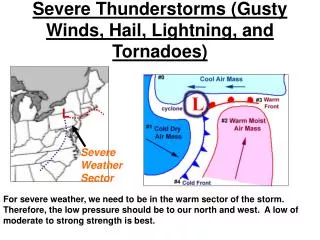
Motivation • Region of study: Mid-Atlantic • Accurately forecasting location, mode and severity of thunderstorms is important, due to proximity of Eastern Seaboard • Region is often characterized by weak forcing and ample instability • Mesoscale boundaries important • Sea breeze boundary • Outflow boundaries • Lee trough
Objectives • Analyze the structure of Appalachian Lee Troughs (ALTs) • Construct a climatology of warm-season ALTs • Analyze the distribution of severe convection in the Mid-Atlantic • Spatial distribution • Temporal distribution • Characteristic CAPE/shear
Data and Methodology • Analyzed 13 cases of ALT events associated with warm-season severe convection • Sterling, VA (LWX) CWA • 0.5° CFSR (Climate Forecast System Reanalysis) • Identified common features and used them as criteria to construct a climatology • May–September, 2000–2009
Lee Trough Formation: PV Perspective • PV = −g(∂θ/∂p)(ζθ+ f) (Static stability)(Absolute vorticity) • d(PV)/dt = 0 for adiabatic flow • Flow across mountain barrier will subside on lee side • Advects higher θ downward → warming • −g(∂θ/∂p) decreases → ζθmust increase → low level circulation Appalachians Appalachians Adapted from Martin (2006)
ALTs – Common Low-Level Features MSLP (black, hPa), 1000–850-hPa thickness (fills, dam), thermal vorticity < 0 (white, 10−5 s−1), 10-m winds (barbs, kt) 1800 UTC Composite (n=13)
ALTs – Common Low-Level Features Winds orthogonal to mountains MSLP (black, hPa), 1000–850-hPa thickness (fills, dam), thermal vorticity < 0 (white, 10−5 s−1), 10-m winds (barbs, kt) 1800 UTC Composite (n=13)
ALTs – Common Low-Level Features Thermal ridge Winds orthogonal to mountains MSLP (black, hPa), 1000–850-hPa thickness (fills, dam), thermal vorticity < 0 (white, 10−5 s−1), 10-m winds (barbs, kt) 1800 UTC Composite (n=13)
ALTs – Common Low-Level Features Thermal ridge Winds orthogonal to mountains Negative thermal vorticity MSLP (black, hPa), 1000–850-hPa thickness (fills, dam), thermal vorticity < 0 (white, 10−5 s−1), 10-m winds (barbs, kt) 1800 UTC Composite (n=13)
ALTs – Common Low-Level Features Thermal ridge Winds orthogonal to mountains Negative thermal vorticity MSLP (black, hPa), 1000–850-hPa thickness (fills, dam), thermal vorticity < 0 (white, 10−5 s−1), 10-m winds (barbs, kt) 0000 UTC Composite (n=13)
Domain for Climatology WIND ZONE ALT ZONE DOMAIN
Methodology for Climatology • Climatology was based on the following 3 criteria: • 925-hPa Wind Direction • Checked for wind component directions orthogonal to and downslope of Appalachians • Appalachians in the Mid-Atlantic are oriented ~ 43° right of true north • Satisfactory meteorological wind directions exist between 223° and 43° • Criterion: wind direction computed from zonal average of wind components along each 0.5° of latitude within Wind Zone must be between 223° and 43° WIND ZONE ALT ZONE DOMAIN
Methodology for Climatology • Climatology was based on the following 3 criteria: • MSLP Anomaly • Averaged MSLP along each 0.5° of latitude within domain • Checked for minimum MSLP along each 0.5° of latitude within ALT Zone • Criterion: difference of minimum and zonal average MSLP must be less than a threshold value WIND ZONE ALT ZONE DOMAIN
Methodology for Climatology • Climatology was based on the following 3 criteria: • 1000–850-hPa layer-mean temperature anomaly • Averaged 1000–850-hPa layer-mean temperature along each 0.5° of latitude within domain • Checked for maximum 1000–850-hPa layer-mean temperature along each 0.5° of latitude within ALT Zone • Criterion: difference of maximum and zonal average 1000–850-hPa layer-mean temperature must be greater than a threshold value WIND ZONE ALT ZONE DOMAIN
Methodology for Climatology • The three criteria must be met for six consecutive 0.5° latitudes • An algorithm incorporating the three criteria was run for the length of the climatology at 6-h intervals (0000, 0600, 1200 and 1800 UTC) • ALTs identified by this algorithm were manually checked for false alarms (e.g. frontal troughs, cyclones, large zonal pressure gradients)
Climatology – Results ← Stricter ← Stricter • Each bubble denotes the percentage of time an ALT is recorded under a particular set of MSLP/temperature anomaly constraints • Boxesindicate the criteria adopted as the ALT definition
Climatology – Results MSLP anomaly < −0.75 hPaTemperature anomaly > 1°C • Over 75% of ALTs occur in June, July and August
Climatology – Results MSLP anomaly < −0.75 hPaTemperature anomaly > 1°C • Over 75% of ALTs occur in June, July and August • Nearly 66% of ALTs occur at 1800 or 0000 UTC • The seasonal and diurnal heating cycles likely play a role in ALT formation
Storm Reports in the ALT Zone – Data and Methodology • Severe local storm reports were obtained from the NCDC Storm Data publication • Included all tornado, severe thunderstorm wind and severe hail (>1”) for May–September, 2000–2009 ALT ZONE
Storm Reports – Daily Distribution Day = 0400 to 0400 UTC • 754 unique days with at least one storm report • 199 days with > 20 storm reports • Most active day: 13 May 2002 (207)
Controlling for Dataset Inconsistencies • “Clustering” – attempt to control for population bias • Overlay a 0.5° by 0.5° grid box over the domain • If a storm report occurs within a certain grid box on a certain day, that grid box is considered “active” for the day • Any subsequent storm reports occurring within the active box are discarded for the day • The number of active grid boxes for each day are tallied to measure how widespread the severe weather was on that day
Storm Reports – Spatial Distribution n=706 CFSR composite of top 10% of severe ALT days. MUCAPE (fills, J/kg) and surface to 500-hPa shear (black, kt) n=48 Percentage of ALT days with >0 active grid boxes (smoothed)
Storm Reports – Spatial Distribution n=706 CFSR composite of top 10% of severe ALT days. MUCAPE (fills, J/kg) and surface to 500-hPa shear (black, kt) n=48 Percentage of ALT days with >0 active grid boxes (smoothed) • Storm report max near D.C. coincides with CAPE/shear maxima • NC local max more difficult to explain
CAPE/Shear at First Daily Storm Report • To quantify severe thunderstorm parameters characteristic of ALT Zone, CAPE/shear was calculated at location of first daily storm report • Dataset: 32 km NARR (8 analysis times daily) • Procedure: • Find location and time of first severe report on a certain day (0400–0359 UTC) • Calculate MUCAPE and Sfc–500-hPa shear at location of storm report using nearest analysis time at least 30 min prior to storm report
CAPE/Shear at First Daily Storm Report • Only included days in which first storm report occurred between 1530and 0029 UTC
CAPE/Shear at First Daily Storm Report • ALT Zone was divided into sectors to minimize the likelihood of the first daily storm report not being representative of the environment NORTH CENTER SOUTH
CAPE/Shear at First Daily Storm Report NORTH • South sector peaks earlier (1800 UTC) than north sector (2000 UTC) • Center sector has flat peak between 1800–2100 UTC CENTER SOUTH
CAPE/Shear at First Daily Storm Report Whiskers: 10th and 90th percentiles // Box edges: 25th and 75th percentiles // Line: median NORTH • Higher median CAPE (shear) for first daily storm report in south (north) sector • Higher shear in north sector is likely because it is nearer to the mean warm-season upper jet CENTER SOUTH
CAPE/Shear at First Daily Storm Report • First daily storm report does not concentrate well in CAPE/shear phase-space
CAPE/Shear at First Daily Storm Report • First daily storm report does not concentrate well in CAPE/shear phase-space No storm reports occurred in this phase-space
CAPE/Shear at First Daily Storm Report Whiskers: 10th and 90th percentiles // Box edges: 25th and 75th percentiles // Line: median • CAPE (shear) at first daily storm report maximized in June, July and August (May and September)
Summary – Key Points • ALTs form preferentially during diurnal and seasonal heating maxima
Summary – Key Points • Distribution of storm reports in ALT Zone varies by latitude • First daily storm report occurs 2 h earlier in south sector compared to north sector
Summary – Key Points • CAPE and shear at first daily storm report vary by latitude and month • Greater median CAPE (shear) occurs in • June, July and August (May and September) • South (north) sector GREATER SHEAR May, Sep GREATER CAPE Jun, Jul, Aug