Download
1 / 37
370 likes | 491 Views
Characteristics and Climatology of Appalachian Lee Troughs. Daniel B. Thompson, Lance F. Bosart and Daniel Keyser Department of Atmospheric and Environmental Sciences University at Albany/SUNY, Albany, NY 12222 Thomas A. Wasula NOAA/NWS, Albany, NY Matthew Kramar NOAA/NWS, Sterling, VA

E N D
Characteristics and Climatology of Appalachian Lee Troughs Daniel B. Thompson, Lance F. Bosart and Daniel Keyser Department of Atmospheric and Environmental Sciences University at Albany/SUNY, Albany, NY 12222 Thomas A. Wasula NOAA/NWS, Albany, NY Matthew Kramar NOAA/NWS, Sterling, VA Northeast Regional Operational Workshop XIII, Albany, NY 3 Nov 2011 NOAA/CSTAR Award # NA01NWS4680002
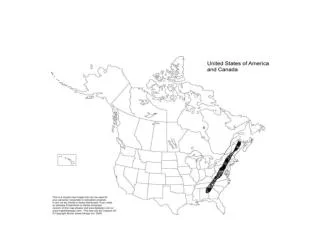
Motivation Region of study: Mid-Atlantic Mid-Atlantic warm season often characterized by: Topography Weak synoptic-scale forcing Increased importance of mesoscale features for triggering convection Horizontal rolls → + Ample instability Surface boundaries
Objectives • Analyze the structure of Appalachian Lee Troughs (ALTs) • Obtain an objective definition of ALTs • Analyze the distribution of severe convection in the Mid-Atlantic
Data and Methodology • Analyzed 13 cases of ALT events associated with warm-season severe convection • Sterling, VA (LWX) CWA • 0.5° CFSR (Climate Forecast System Reanalysis) • Identified common features and used them as criteria to construct a climatology • May–September, 2000–2009 • Categorized ALTs based on their relationship with synoptic-scale cold fronts
Lee Trough Formation: PV Perspective • PV = −g(∂θ/∂p)(ζθ+ f) (Static stability)(Absolute vorticity) • d(PV)/dt = 0 for adiabatic flow • Flow across mountain barrier will subside on lee side • Advects higher θ downward → warming • −g(∂θ/∂p) decreases → ζθmust increase → low level circulation Appalachians Appalachians Adapted from Martin (2006)
ALTs – Common Low-Level Features NEXRAD 2-km Mosaic (dBZ) 2056 UTC 22 July 2008 Source: College of DuPage MSLP (black, hPa), 1000–850-hPa thickness (fills, dam), thermal vorticity < 0 (white, 10−5 s−1), 10-m winds (barbs, kt)
ALTs – Common Low-Level Features NEXRAD 2-km Mosaic (dBZ) 2056 UTC 22 July 2008 Source: College of DuPage MSLP (black, hPa), 1000–850-hPa thickness (fills, dam), thermal vorticity < 0 (white, 10−5 s−1), 10-m winds (barbs, kt)
ALTs – Common Low-Level Features A NEXRAD 2-km Mosaic (dBZ) 2056 UTC 22 July 2008 Source: College of DuPage A’ MSLP (black, hPa), 1000–850-hPa thickness (fills, dam), thermal vorticity < 0 (white, 10−5 s−1), 10-m winds (barbs, kt)
ALTs – Common Low-Level Features Potential temperature (black, K), geostrophic relative vorticity (fills, 10−5 s−1),winds (barbs, kt) 100 km
ALTs – Common Low-Level Features Potential temperature (black, K), geostrophic relative vorticity (fills, 10−5 s−1),winds (barbs, kt) Geostrophic Relative Vorticity Maximum 100 km
ALTs – Common Low-Level Features Potential temperature (black, K), geostrophic relative vorticity (fills, 10−5 s−1),winds (barbs, kt) Warm Core Geostrophic Relative Vorticity Maximum 100 km
ALTs – Common Low-Level Features • Vertical extent of warm core ranges between 850 hPa and 700 hPa • Average: 788 hPa • Standard deviation: 61 hPa
Domain for Climatology WIND ZONE ALT ZONE DOMAIN
Methodology for Climatology • Climatology was based on the following 3 criteria: • 925-hPa Wind Direction • Checked for wind component directions orthogonal to and downslope of Appalachians • Appalachians in the Mid-Atlantic are oriented ~ 43° right of true north • Satisfactory meteorological wind directions exist between 223° and 43° • Criterion: wind direction computed from zonal average of wind components along each 0.5° of latitude within Wind Zone must be between 223° and 43° WIND ZONE ALT ZONE DOMAIN
Methodology for Climatology • Climatology was based on the following 3 criteria: • MSLP Anomaly • Averaged MSLP along each 0.5° of latitude within domain • Checked for minimum MSLP along each 0.5° of latitude within ALT Zone • Criterion: difference of minimum and zonal average MSLP must be less than a threshold value WIND ZONE ALT ZONE DOMAIN
Methodology for Climatology • Climatology was based on the following 3 criteria: • 1000–850-hPa layer-mean temperature anomaly • Averaged 1000–850-hPa layer-mean temperature along each 0.5° of latitude within domain • Checked for maximum 1000–850-hPa layer-mean temperature along each 0.5° of latitude within ALT Zone • Criterion: difference of maximum and zonal average 1000–850-hPa layer-mean temperature must be greater than a threshold value WIND ZONE ALT ZONE DOMAIN
Methodology for Climatology • The three criteria must be met for six consecutive 0.5° latitudes • An algorithm incorporating the three criteria was run for the length of the climatology at 6-h intervals (0000, 0600, 1200 and 1800 UTC) • ALTs identified by this algorithm were manually checked for false alarms (e.g. frontal troughs, cyclones, large zonal pressure gradients)
Climatology – Results ← Stricter ← Stricter • Each bubble denotes the percentage of time an ALT is recorded under a particular set of MSLP/temperature anomaly constraints • Boxesindicate the criteria adopted as the ALT definition
Climatology – Results MSLP anomaly < −0.75 hPaTemperature anomaly > 1°C
Climatology – Results MSLP anomaly < −0.75 hPaTemperature anomaly > 1°C • Over 75% of ALTs occur in June, July and August
Climatology – Results MSLP anomaly < −0.75 hPaTemperature anomaly > 1°C • Over 75% of ALTs occur in June, July and August • Nearly 66% of ALTs occur at 1800 or 0000 UTC • The seasonal and diurnal heating cycles likely play a role in ALT formation
ALT Categories • ALTs can be grouped into four categories based on their relationship with synoptic-scale cold fronts • ALTs that occur in advance of cold fronts can be considered prefrontal troughs (PFTs) • Categories: • Inverted • No PFT: Non-prefrontal • PFT, partial FROPA: Prefrontal without frontal passage through entire ALT Zone • PFT, total FROPA: Prefrontal with frontal passage through entire ALT Zone
ALT Categories – Examples • Inverted – trough extends northward from south of the ALT Zone 0000 UTC 31 May 2001 MSLP (black, hPa) and 1000–850-hPa thickness (fills, dam)
ALT Categories – Examples • No PFT – trough occurs in the absence of a synoptic cold front 0000 UTC 10 July 2000 MSLP (black, hPa) and 1000–850-hPa thickness (fills, dam)
ALT Categories – Examples • PFT, partial FROPA • Front must be south of the NY/PA border or east of the western third of PA • Front does not pass through entire ALT Zone 0000 UTC 3 June 2000 MSLP (black, hPa) and 1000–850-hPa thickness (fills, dam)
ALT Categories – Examples • PFT, total FROPA • Front must be south of the NY/PA border or east of the western third of PA • Front passes through entire ALT Zone within 24 h 1800 UTC 13 May 2000 MSLP (black, hPa) and 1000–850-hPa thickness (fills, dam)
ALT Categories – Climatology • Category 2 (No PFT) occurs most frequently
ALT Categories – Climatology • Category 2 (No PFT) occurs most frequently • PFTs account for 44.8% of ALTs • How does the spatial distribution of convection change between categories? • How does this distribution change between PFTs and non-PFTs? • To be determined
ALT Categories – Monthly Distribution • Category 2 and 3 are more common in JJA, while category 4 is more common in May and September • Stronger westerlies, more FROPA during “transition months”
ALT Climatology in the Northeast Different domain, same procedure as Mid-Atlantic NORTHEAST INTERMOUNTAIN REGION (NEI) NORTHEASTCOASTAL PLAIN (NECP)
ALT Climatology in the Northeast – Results • Most ALTs recorded in Mid-Atlantic • More favorable terrain? • 39% of ALTs in NECP were postfrontal • Convection unlikely • Caveats: • Smaller-scale troughs may be undetected • Does not represent complete climatology of PFTs NEI NECP
Storm Reports in the ALT Zone – Data and Methodology • Severe local storm reports were obtained from the NCDC Storm Data publication • Examined all tornado, severe thunderstorm wind and severe hail (>1”) for May–September, 2000–2009 ALT ZONE climate.met.psu.edu
Storm Reports – Daily Distribution Day = 0400 to 0400 UTC • 12,330 storm reports • 754 unique days with at least one storm report • 199 days with > 20 storm reports • Most active day: 13 May 2002 (207)
Storm Reports – Daily Distribution • Pronounced mid-afternoon/early evening maximum in storm reports between 2100 and 2300 UTC
ALTs and Convection – Further Questions • What influence does an ALT have on the distribution of convection, with respect to location, mode and severity? • What influence do each of the ALT categories have on this distribution? • To be determined
Summary – Key Points • ALTs have a shallow, warm core • ALTs form preferentially during diurnal and seasonal heating maxima • Monthly distribution of ALTs varies depending on the ALT category • Classic, terrain-induced ALTs are more likely in June, July and August • ALTs associated with complete FROPA are more likely during May and September • ALTs are more likely in the Mid-Atlantic than the Northeast • The ALT Zone has a distinct diurnal maximum in storm reports