Download

1 / 47
470 likes | 475 Views
Explore mathematical models and distributions, including normal distributions, and learn how to calculate probabilities using z-scores and percentiles.

E N D
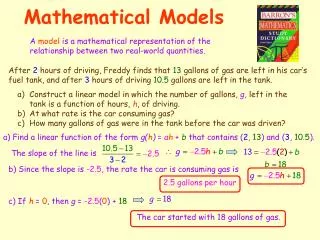
What is a mathematical model? • A mathematical model is a representation of a real-world object or phenomenon. • Mathematical models are generally over-simplifications that represent only the prominent features of the object or phenomenon.
MLB: Home Runs in 2016 Mean = 400.03 ft. Std. Dev. = 25.702 ft.
MLB: Home Runs in 2016 Mean = 400.03 ft. Std. Dev. = 25.702 ft.
MLB: Home Runs in 2016 The proportion of area under the curve between 350 and 400 is 0.4737 So approximately 47.37% of homeruns in 2016 traveled a distance between 350 ft. and 400 ft. Online calclulator: http://onlinestatbook.com/2/calculators/normal_dist.html
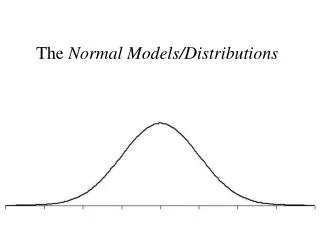
Normal distribution • Unimodal and symmetric, bell-shaped curve • Many variables are nearly normal, but none are exactly normal • Denoted by N(μ,σ) –Normal with mean μ and standard deviation σ.
Comparing SAT and ACT test scores SAT scores are normally distributed with mean 1500 and standard deviation 300. ACT scores are normally distributed with mean 21 and standard deviation 5. A college admissions officer wants to determine which of two applicants scored better: Pam scored1800 on the SAT, and Jim scored 24 on the ACT.
Comparing SAT and ACT test scores SAT scores are normally distributed with mean 1500 and standard deviation 300. ACT scores are normally distributed with mean 21 and standard deviation 5. A college admissions officer wants to determine which of two applicants scored better: Pam scored1800 on the SAT, and Jim scored 24 on the ACT.
Comparing SAT and ACT test scores SAT scores are normally distributed with mean 1500 and standard deviation 300. ACT scores are normally distributed with mean 21 and standard deviation 5. A college admissions officer wants to determine which of two applicants scored better: Pam scored1800 on the SAT, and Jim scored 24 on the ACT.
Standardizing with z-scores Since we cannot just compare these two raw scores, we instead compare how many standard deviations beyond the mean each observation is. • Pam’s score is (1800-1500)/300 = 1 standard deviation above the mean • Jim’s score is (24-21)/5 = 0.6 standard deviations above the mean.
Standardizing with z-scores (cont.) • The z-score of an observation is the number of standard deviations it falls above or below the mean. , or • We can use z-scores to compute percentiles.
Percentiles • A percentile is the percentage of observations that fall below a given data point. • Graphically, a percentile is the area below the standard normal curve, N(0,1), to the left of that observation.
Computing percentiles: calculator • Hit 2nd Distr and choose “normalcdf” (option 2). normalcdf(-10^9,1800,1500,300), or normalcdf(-10^9,1)
Example: quality control At a Heinz ketchup factory the amounts which go into the bottles are supposed to be normally distributed with mean 36 oz. and standard deviation of 0.11 oz. Once every 30 minutes a bottle is selected from the production line, and its contents are precisely noted. If the amount of ketchup in the bottle is below 35.8 oz. or above 36.2 oz., then the bottle fails the quality control inspection. What percent of bottles should have less than 35.8 ounces of ketchup?
Example: quality control At a Heinz ketchup factory the amounts which go into the bottles are supposed to be normally distributed with mean 36 oz. and standard deviation of 0.11 oz. Once every 30 minutes a bottle is selected from the production line, and its contents are precisely noted. If the amount of ketchup in the bottle is below 35.8 oz. or above 36.2 oz., then the bottle fails the quality control inspection. What percent of bottles should have less than 35.8 ounces of ketchup? N(36,0.11)
Example: quality control At a Heinz ketchup factory the amounts which go into the bottles are supposed to be normally distributed with mean 36 oz. and standard deviation of 0.11 oz. Once every 30 minutes a bottle is selected from the production line, and its contents are precisely noted. If the amount of ketchup in the bottle is below 35.8 oz. or above 36.2 oz., then the bottle fails the quality control inspection. What percent of bottles should have less than 35.8 ounces of ketchup? N(36,0.11)
On the calculator • Hit 2nd Distr and choose “normalcdf” (option 2). normalcdf(-10^9,35.8,36,0.11), or normalcdf(-10^9,-1.82)
Example: quality control (cont.) What percent of bottles pass the quality control inspection?
Example: quality control (cont.) What percent of bottles pass the quality control inspection?
Example: quality control (cont.) What percent of bottles pass the quality control inspection? =
Example: quality control (cont.) What percent of bottles pass the quality control inspection? = -
Example: quality control (cont.) What percent of bottles pass the quality control inspection? = -
Example: quality control (cont.) What percent of bottles pass the quality control inspection? = -
Example: quality control (cont.) What percent of bottles pass the quality control inspection? = - 0.9656 – 0.0344 = 0.9312 or 93.12%
On the calculator • Hit 2nd Distr and choose “normalcdf” (option 2). Normalcdf(35.8,36.2,36,0.11)
Finding cutoff points: with table Body temperatures of healthy humans are approximately normally distributed with mean 98.20 F and standard deviation 0.730 F. What is the cutoff for the lowest 3% of human body temperatures?
Finding cutoff points: with table Body temperatures of healthy humans are approximately normally distributed with mean 98.20 F and standard deviation 0.730 F. What is the cutoff for the lowest 3% of human body temperatures?
Finding cutoff points: with table Body temperatures of healthy humans are approximately normally distributed with mean 98.20 F and standard deviation 0.730 F. What is the cutoff for the lowest 3% of human body temperatures?
Finding cutoff points: with table Body temperatures of healthy humans are approximately normally distributed with mean 98.20 F and standard deviation 0.730 F. What is the cutoff for the lowest 3% of human body temperatures?
Finding cutoff points: with table Body temperatures of healthy humans are approximately normally distributed with mean 98.20 F and standard deviation 0.730 F. What is the cutoff for the lowest 3% of human body temperatures?
Finding cutoff points: with calculator Body temperatures of healthy humans are approximately normally distributed with mean 98.20 F and standard deviation 0.730 F. What is the cutoff for the lowest 3% of human body temperatures?
Finding cutoff points: with calculator Body temperatures of healthy humans are approximately normally distributed with mean 98.20 F and standard deviation 0.730 F. What is the cutoff for the lowest 3% of human body temperatures? On calculator: 2nd Distr. And choose “invnorm” (option 3) invnorm(0.03,98.2,0.73)
Finding cutoff points: with table Body temperatures of healthy humans are approximately normally distributed with mean 98.20 F and standard deviation 0.730 F. What is the cutoff for the highest 10% of human body temperatures?
Finding cutoff points: with table Body temperatures of healthy humans are approximately normally distributed with mean 98.20 F and standard deviation 0.730 F. What is the cutoff for the highest 10% of human body temperatures?
Finding cutoff points: with table Body temperatures of healthy humans are approximately normally distributed with mean 98.20 F and standard deviation 0.730 F. What is the cutoff for the highest 10% of human body temperatures?
Finding cutoff points: with table Body temperatures of healthy humans are approximately normally distributed with mean 98.20 F and standard deviation 0.730 F. What is the cutoff for the highest 10% of human body temperatures?
Finding cutoff points: with table Body temperatures of healthy humans are approximately normally distributed with mean 98.20 F and standard deviation 0.730 F. What is the cutoff for the highest 10% of human body temperatures?
Finding cutoff points: with calculator Body temperatures of healthy humans are approximately normally distributed with mean 98.20 F and standard deviation 0.730 F. What is the cutoff for the highest 10% of human body temperatures? On calculator: 2nd Distr. And choose “invnorm” (option 3) invnorm(0.90,98.2,0.73)
95% of female adult heights are between 58 and 72 inches • 95% of male adult heights are between 62 and 78 inches Example: Adult Heights