Download
1 / 22
220 likes | 299 Views
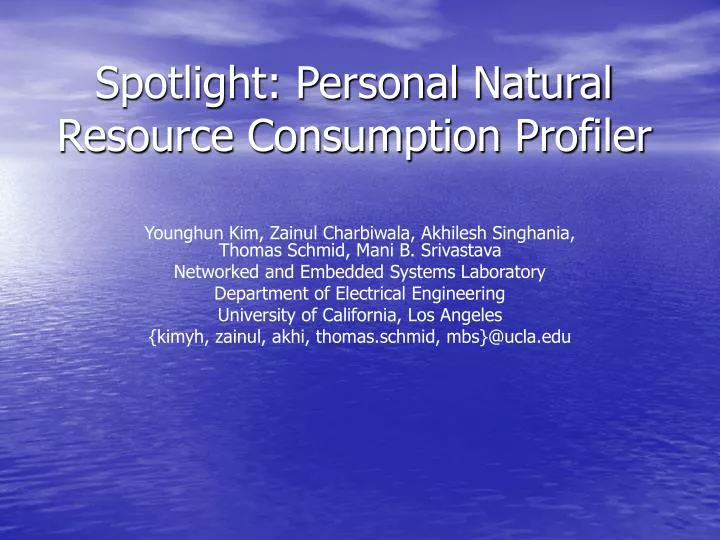
Spotlight: Personal Natural Resource Consumption Profiler. Younghun Kim, Zainul Charbiwala, Akhilesh Singhania, Thomas Schmid, Mani B. Srivastava Networked and Embedded Systems Laboratory Department of Electrical Engineering University of California, Los Angeles

E N D
Spotlight: Personal Natural Resource Consumption Profiler Younghun Kim, Zainul Charbiwala, Akhilesh Singhania, Thomas Schmid, Mani B. Srivastava Networked and Embedded Systems Laboratory Department of Electrical Engineering University of California, Los Angeles {kimyh, zainul, akhi, thomas.schmid, mbs}@ucla.edu
Outline • Problem Definition • Introduction of SPOTLIGHT • System Architecture • Prototype Implementation • Evaluation • Conclusion
Problem Definition • Severe natural disasters due to global climate changes • An urge to optimize resource consumption due to natural resource crisis. • Household level and monthly basis resource consumption measurement Very vague
Motivation • Individual wants to have fine grained information of the resource consumption. • Study shows individuals are willing to conserve energy. • Measurement of energy, water, and other resources at person level.
Introduction of SPOTLIGHT • Resource measuring system using sensor network technology. • Estimating an individual’s personal resource consumption profiler. • Use commercially available components • Currently focusing on electrical energy.
Resource Monitoring Subsystem (1/3) • Examples of available technologies: Power and gas meters for apartments. • Problem: Information not at per individual level.
Resource Monitoring Subsystem (2/3) • Challenges: • Scalability • Accuracy • Non-obstructive due to aesthetic, privacy and security concerns.
Resource Monitoring Subsystem (3/3) • Aims to profile energy consumption of each appliance based on the status of an appliance and total consumption.
Activity Monitoring Subsystem • Identify who and what activities happened in the area of interest. • Existing activity recognition approaches but issue of mass deployment due to complexity and cost reason still persists. • Aims to fuse information from both activity and resource monitoring to improve accuracy.
Resource Management Subsystem • Fuse data provided by resource monitoring and activity monitoring subsystems • Provide persuasive resource usage report • Employ Smart Resource Controller to improve resource saving.
Prototype Implementation (1/2) • Monitor the power consumption in a small household. • Participating appliances: Lighting, coffee machine and TV. • Regards physical proximity and the appliance status as an activity indicator.
Prototype Implementation (2/2) • MicaZ: • Used to for sensing proximity of the user to the appliance • Communicating with SPOTLIGHT server • Connected to the serial interface of power meter
1. Sends out beacon messages 2. Sends out RSSI and Power Measurement 3. Identify user proximity and individual electrical energy consumption
Evaluation of RSSI based Activity Region • Define the a rough activity region • Traverse along the boundaries and the system averages RSSI for initial calibration. • Issues tokens, an indication of current activity.
Comparison With Ground Truth • Installed cameras monitoring the activity regions. • Provided information of who was present in the activity region.
Future Work • Measuring water consumption of a household. • Using accelerometer connected to the water pipe. • Vibration of the pipe is a good indicator of how much water flows through the pipe
Conclusion • Providing information on resource consumption is meaningful for inducing resource-conserving behavioral changes • Such a system needs to fuse different embedded sensing system, machine learning technique and algorithm