Download
1 / 22
220 likes | 363 Views
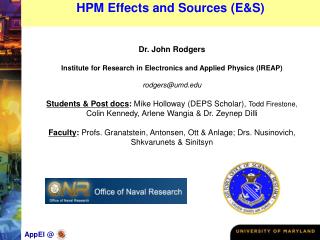
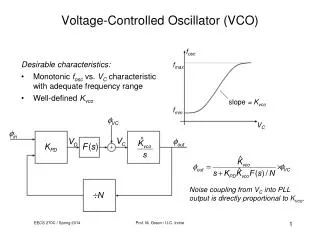
Investigation of HPM Effects in Voltage Controlled Oscillators. Dr. John Rodgers and Cristina Allen University of Maryland Mid Progress Report July, 2010 Submitted to Dr. Bill Zimmerman Voss Scientific. ZX95-988 VCO Characteristics. I-V Curve (Diode-Like). Slope = 26.29 MHz/V.

E N D
Investigation of HPM Effects in Voltage Controlled Oscillators Dr. John Rodgers and Cristina Allen University of Maryland Mid Progress Report July, 2010 Submitted to Dr. Bill Zimmerman Voss Scientific
ZX95-988 VCO Characteristics I-V Curve (Diode-Like) Slope = 26.29 MHz/V
VCO Experiment • The nonlinear I-V characteristic of the tuning input provided evidence that this port may be unstable under pulsed RF excitation. • We characterized the VCO operation when the tuning voltage consists of an RF pulse superimposed on a DC bias. • A wideband bias tee was utilized to combine the DC and RF signals. • The RF amplitude was stepped in 50 mV increments from 50 – 1000mV. The pulse width was fixed at 100 ms. Carrier frequencies 500 < f < 4000 MHz were investigated. • The VCO output waveform was digitized and recorded for each frequency and amplitude step. Subsequently, the FFT of the time-domain signal was calculated to give the RF spectrum. • Composite spectrograms were constructed to analyze how the VCO output varied with excitation parameters.
Results when RF was injected at frequencies near the VCO fundamental showing a frequency pulling and broadening effect (Representative Spectrograms) Injected Carrier f = 887 MHz Injected Carrier f = 903 MHz Note: Normal VCO output frequency for Vtune = 0is approximately893.8MHz
More examples of effects when injected frequency is close to VCO fundamental frequency Phase Locking Phase Locking Spectral Broadening
Results with RF near the second harmonic of the VCO fundamental (1.784-1.804GHz)
Results with RF near the third harmonic of the VCO fundamental frequency (2.681-2.701GHz)
Supplemental Data • The following series of slides shows examples of the results for various tuning voltages and injection frequencies:
Fundamental Frequency Range(908-928MHz) • Note: Average VCO output for Vtune = 0.5V is 915.2MHz
Fundamental Frequency Injection(908-928 MHz) Behavior when injected frequency is close to VCO output frequency @ Vt = 0.5V
Second Harmonic Frequency(1.826-1.846GHz) Representative of 1.836-1.846GHz Representative of 1.826,1.828, and 1.832GHz
Second Harmonic Frequency(1.826-1.846GHz) Only plot that deviated from representative plot. Injected frequency is thesecond harmonic of VCO output.
Fundamental Frequency (925-945MHz) Representative of 925-925MHz Representative of 935-945MHz Note: VCO frequencyfor Vt = 1.0V is932.75MHz
Vt = 1.0 V Behavior when injected frequency is close to VCO output frequency
Second Harmonic Frequency(1.860-1.880GHz) Only plot that deviated from representative plot. Injected frequency is double VCO output frequency (actual second harmonic of VCO output).
Third Harmonic Frequency(2.795-2.815GHz) Only plot that deviated from representative plot. Injected frequency is third VCO output frequency (actual third harmonic of VCO output).
Third Harmonic Frequency(2.795-2.815GHz) This plot had the overall shape of the representative plot, but showed a the highest spectral broadening.
Conclusions • RF coupled into the diode at the tuning voltage input drives the P-N junction into nonlinearity. This process generates spurious voltages which produce unstable VCO operation. • The VCO is particularly sensitive to RF pulses when the carrier frequency is near harmonics of the VCO output. • In the most sensitive cases, RF pulse amplitudes as low as 100 mV were enough to drive instability in the VCO. • The effects observed in the experiments can be categorized generally as follows: • Spectral broadening • Phase locking of the VCO to the RF carrier frequency • Generation of nonlinear frequency products
Current and Near-Future Efforts • We are now developing nonlinear circuit models based on the results of the data presented here. • Initially, we will model direct injection of RF into the tuning voltage input and compare the numerical and experimental results. This will provide initial validation of the circuit models. • The VCO circuit will be tested in the UMD radiation chamber where the RF coupling, transmission and effects will be characterized. • Finally, the results of the chamber tests will be compared with simulations using a combination of the deterministic circuit effects models and the Voss coupling models.