Download
1 / 68
680 likes | 765 Views
Market Technicians Association, Inc. 61 Broadway, Suite 514. New York, NY 10006 Web: www.mta.org Phone: 646-652-3300 Fax: 646-652-3322. The 2011 Outlook Mukul Pal, CMT. Idea. Vilfredo Pareto (1848-1923) Father of Microeconomics. Who saw the curve?. 80-20 Price and Time.

E N D
Market Technicians Association, Inc. 61 Broadway, Suite 514. New York, NY 10006 Web: www.mta.org Phone: 646-652-3300 Fax: 646-652-3322 The 2011 OutlookMukul Pal, CMT
Vilfredo Pareto(1848-1923)Father of Microeconomics Who saw the curve?
80-20 Price and Time 20% Time, 80% price change 80% Time, 20% price change
Exponentiality Exponential Symmetry
Sub divisions Counting Elliott did not know Fibonacci 5 3 e 1 4 c d 2 a e b c d a e c b a d b
80-20 Price and Time 20% Time, 80% price change 80% Time, 20% price change
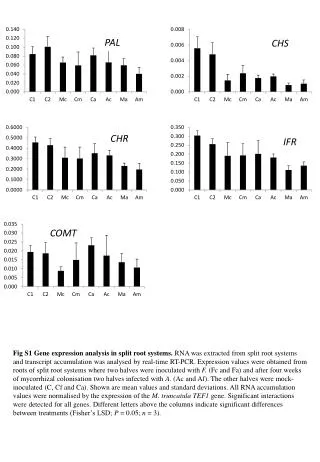
Analysis When we look at time duration for the 23 stocks we find most distributions to have an exponential nature. Our results are based on analyzing ≈ 5000 time duration data points representing rate of change inflexion around a mean value of 1 over the daily data ≈ 50,000 price data points for the period January 2000—October 2010. Figure 2 displays the ascending sequence of the time duration data. We observe that the distribution has an exponential form and decay. P(g) ~ e−βg With β = 2.4 ± 0.037
Market Influences • News • Fundamentals • Demand and Supply • Technical Analysis • Sentiment
Top 10 – 1D Romania
Top 10 – 5 day India
Pattern • Chance • Where is the pattern? • Is curve a pattern? • Is the curve mathematical?
A week • Umm.. • Ok I see it • It’s a curve • It looks similar on two degrees of time • Did any news came this week?
Few weeks • It’s repeating • A similar curve. • There was news, demand, supply • Technicals and fundamentals
Few months • wow • How is this happening? • Nothing changes it • News, demand, supply, technicals, fundamentals • Mysterious force
Year • Pattern continues despite all market influences.
Region, Sector • Pattern in the region • Pattern in a sector
Region, Sector, America • Pattern in the region • Pattern in a sector • Pattern in America
Region, Sector, America, in time • Pattern in the region • Pattern in a sector • Pattern in America • Across degrees of time
S&P500 – 1d Southwestern Energy Company (SWN.N) Citrix Systems, Inc. (CTXS.OQ)
S&P500 – 5d Host Hotels & Resorts, Inc. (HST.N) Coca-Cola Enterprises Inc. (CCE.N)
S&P500 – MTD Marathon Oil Corporation (MRO.N) Coca-Cola Enterprises Inc. (CCE.N)
S&P500 – 1M Carnival Corporation (CCL.N) Coca-Cola Enterprises Inc. (CCE.N)
S&P500 – 3M Genzyme Corporation (GENZ.OQ) Micron Technology, Inc. (MU.OQ)
S&P500 – 6M Teradata Corporation (TDC.N) Office Depot
S&P500 – YTD Genzyme Corporation (GENZ.OQ) H&R Block, Inc. (HRB.N)
S&P500 – 1Y Dean Foods
What is this pattern? • It’s a curve • Exponentiality • Small Big gains • Small Big loss • Lot of sideways action • It’s a cycle • Show me the cycle?
Region, Sector, America, in timeall over • Pattern in the region • Pattern in a sector • Pattern in America • Across degrees of time • Across universe of stocks
What does the curve mean? • Performance is ordered • Performance is cyclical • Performance is cyclical across time frames • Stocks move up and down in performance • They outperform and underperform in an ordered sequence • The sequence is a pattern of Time • Time is exponential • Time is the real price