Download
1 / 52
520 likes | 652 Views
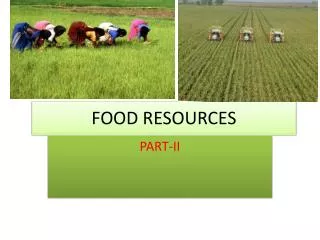
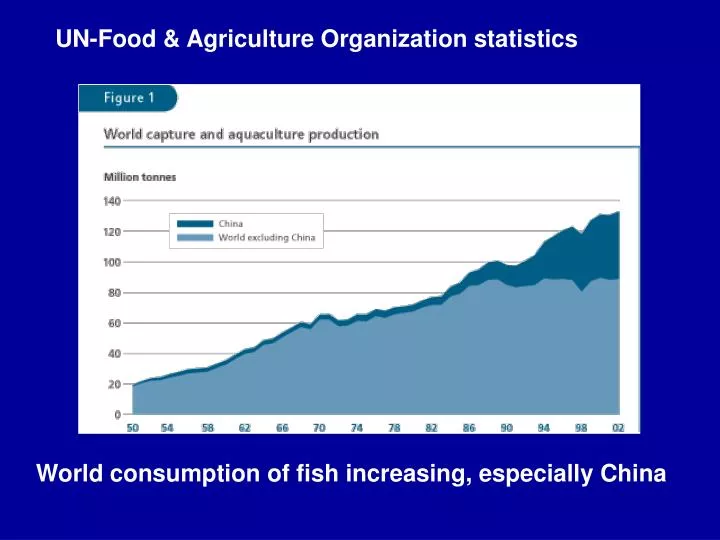
UN-Food & Agriculture Organization statistics. World consumption of fish increasing, especially China. Capture fishery = wild fish & other spp. caught from Oceans, Lakes & rivers Aquaculture = domestic fish & other spp. raised in ponds or floating cages.

E N D
UN-Food & Agriculture Organization statistics World consumption of fish increasing, especially China
Capture fishery = wild fish & other spp. caught from Oceans, Lakes & rivers Aquaculture = domestic fish & other spp. raised in ponds or floating cages
Aquaculture driving big increases in fish consumption in China
Aquaculture ponds can provide food, but can also cause pollution that harms natural rivers, lakes and oceans Inland fish ponds in China FAO/20044
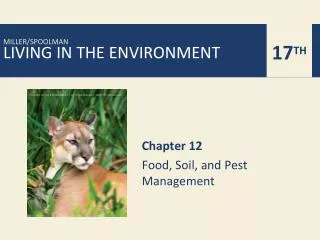
Goal of Capture Fisheries Determine maximum harvest that can be taken without impairing the prospects of exploiting the fishery in the future How many fish can be taken without destroying the stock? traditionally thought of as Maximum Sustainable Yield (MSY) Most recent thinking suggests that more holistic view should be taken…… we’ll talk about why.
Fisheries science began in it’s modern form between WWI & WWII Much work by fishery scientists estimating how much can be taken. Many methods & models. Many technical aspects derived from basic population biology
harvest growth K Hypothetical fish population responds to harvest regimes assume “s-shaped” population growth K Biomass Time
small harvest slower growth, top of S curve Hypothetical fish population responds to harvest regimes K Biomass Time
keeps biomass oscillating around K/2, highest growth rate, leads to MSY regular harvests K Biomass Time Hypothetical fish population responds to harvest regimes
population drops to non-viable level- below critical number Hypothetical fish population responds to harvest regimes frequent harvest K Biomass Time
K Biomass Time Hypothetical fish population responds to harvest regimes recovery takes time generation time survival
borderline between 2 scenarios can be fine line spatial variability temporal variability other species inaccurate biomass estimate MSY can be risky K Biomass Time
borderline between 2 scenarios can be fine line spatial variability temporal variability other species inaccurate biomass estimate MSY can be risky K Biomass Time
Climate= source of uncertainty Natural year to year variation Climate change models predict more extreme events
Individual stocks can crash….. South American anchovies were ~20% of world catch at this time Heavy fishing maintained during El Nino year.
Normal year Trade winds blow west across Pacific. Warm surface water end up in the west Pacific, sea surface is about .5 m higher at Indonesia than at Ecuador Sea surface temperature ~ 8 C higher in west, w/ cool temperatures off South America, due to an upwelling of cold water from deeper levels Cold water is nutrient-rich, supporting high levels of primary productivity, El Niño Trade winds relax in the central and western Pacific Depression of the thermocline in the eastern Pacific, and an elevation of the thermocline in the west. Reduced upwelling to cool the suface and cut off the supply of nutrient rich
Normal year Warm surface water pushed west, sea surface ~ .5 m higher at Indonesia than at Ecuador Surface temp ~ 8 C cooler off South America, due to an upwelling of cold water from deeper levels Cold water is nutrient-rich, supports high levels of primary productivity, Trade winds http://www.fnoc.navy.mil/PUBLIC/
Trade winds warm surface water cold high nutrient water Normal Year Asia South America
El Niño Asia South America Trade winds warm surface water cold high nutrient water
El Niño Trade winds relax in the central and western Pacific Warm surface water not pushed west Reduced upwelling of cool nutrient-rich water to surface Trade winds http://www.fnoc.navy.mil/PUBLIC/
ratchet effect Fisheries scientists give their best information to managers, who must weigh this against sociopolitical consequences. If the scientists say “we are overfishing! stop!!”, but the community says “you’ll cause economic ruin and collapse!” what does the manager do? There is rarely political pressure for lower harvest rates, and often scientists have some doubts about their estimates…
One of the most infamous recent collapses, caused by the ratchet effect, was the loss of the great cod stocks around Newfoundland and Nova Scotia.
Despite the repeated warnings of Canadian fisheries scientists, some of whose voices were quelled by their superiors, catches were allowed to exceed the biomass of the spawning stock. Crustaceans (lobster, shrimp) Water column fish Bottom oriented fish Not just cod catches down, many species
Despite individual stock crashes, according to world Food & Agriculture Organization (FAO) total marine catch is going up.
But…… effort has been increasing …. the ratchet effect in action? source FAO rate of increase slowing In addition to # ships, technology (catch efficiency) has improved
Over fishing effects the target stock and: by-catch species habitat destruction (reefs) trophic relationships
And…. when catch is examined more closely Bottom fish catches (demersals) declining Small midwater fish (pelagics) increasing Discards increasing!
large scale seining Bycatch, or the non-targeted fish that also get taken, may constitute far more biomass than the targeted species. Bycatch is often composed of juvenile individuals of target species – so they’re being removed before they can mature and reproduce (“like eating your seed corn”)
Total discarded catch is ~25% of all catch and much more for some fisheries How much do you like shrimp? Crab are an exception to this-gear very targeted
Over fishing effects the target stock and: by-catch species habitat destruction (reefs) trophic relationships
A scraped benthic habitat stands in stark contrast to an undisturbed area Demersal fish, like cod and haddock, depend on there being benthic organisms on which to feed.
Trawling imperils little known deep reefs; may affect future catch
Over fishing effects the target stock and: by-catch species habitat destruction (reefs) trophic relationships
Trophic level of catch is decreasing Assume that fisheries switch to low trophic level species in response to abundance
Norway pout http://www.fauna.is/Pages/archves/fish4/spaerlingur.html euphausiid krill http://lifesci.lscf.ucsb.edu/~biolum/organism/pictures/euphausiid.html copepods North Sea Increased fishing of pout could cause trophic cascade, might eventually feed back to cod! Cod & other human food fish
Toward an “ecological holism”: can fisheries be managed from an ecosystem perspective?? • “Holistic” means considering the (eco)system and its complexity • Fisheries management has historically ignored the ecosystem – focus on single species management • New atmosphere for • multi-species management, • ecosystem conservation (ex. Marine Protected Areas) • backing away from MSY and that thinking • empowerment of the fisherman – understanding what their impact is, long-term sustainability is best
Other threats exist on the land: Dams keep migratory fishes from their spawning grounds Deforestation has many effects on aquatic ecosystems – affects the fish! Cannot forget that many fish spp. are “land-ocean linkers” – need healthy terrestrial ecosystems All of these things will affect freshwater fisheries too
Lost Fisheries of the Great Lakes Superior Huron Ontario Michigan Erie
Lake Sturgeon -Pre-1850 fisherman perceived lake sturgeon as a nuisance because they destroy fishing gear -Wide-spread slaughter -Economic importance recognized, commercial fishery by mid- to late-1800s. -In 1885, 8.6 million pounds harvested, 5.2 million pounds from Lake Erie. -By the late 1900's, 80% of the lake sturgeon were removed from Lake Erie. -Commercial harvest reported until 1977, but very low after 1956. -Late 1970's, Canadian fishery Lake Erie harvest 3 to 5 thousand pounds Lake Michigan, commercial harvest closed in 1929 after catch declined to only 2000 pounds
Trends in Lake Sturgeon Catches in the Great Lakes (from Harkness and Dymond 1961)
-Only a remnant population remains today in most Great Lakes areas. -Recognized by the American Fisheries Society as threatened in North America and, listed as Endangered, Threatened, or Special Concern in 19 of 20 states throughout its range. -Habitat loss also contributing factor -Damming of tributaries prevented access to historical spawning groun -Siltation on spawning areas (from deforestation, agriculture, and dredging) -Pollution from nutrients and contaminants -Interest in the restoration has increased greatly. -Zebra mussels may be a food source -Lake sturgeon throughout the Great Lakes appear to be on the rebound. -Sign that natural reproduction is occurring
Blue Pike (walleye relative) Once an important part of the ecosystem of Lake Erie and a significant catch for the commercial fishing industry. One of the few fish in Lake Erie to spawn in deep clear water, (primarily the eastern two-thirds) and chose deeper, Annual commercial catch that often exceeded 20 million pounds (an estimated $150 million today) Unable to tolerate the pollution of and over-fishing Last successful spawning occurred in 1954, and the fishery collapsed entirely within three years Declared extinct in September of 1983
Possible that a few were transferred to smaller lakes But……… no DNA from a real blue pike to compare to Angler named Jim Anthony had a fish in his freezer for the past 37 years, a possible blue pike Offspring of a female blue pike and a male walleye so DNA is not that of an authentic blue pike.
Health concerns due to contaminants if fish & seafood Metals and metal-like elements such as arsenic, cadmium, lead, mercury, & others Persistent organic pollutants such as polychlorinated biphenyls (PCBs), dioxins, and some insecticides. These substances tend to accumulate and persist in the environment. Processing-related compounds such as sulphites (used in shrimp processing), and residues of drugs used in aquaculture (e.g., antibiotics and hormones).