Download
1 / 20
200 likes | 311 Views
Stronger Smarter: From Hope to Expectation 6 August, 2014 Dr Chris Sarra www.strongersmarter.com.au www.twitter.com/chrissarra www.wordpress.com/chrissarra. Effects of the Stronger Smarter Approach at Cherbourg SS U nexplained absenteeism reduced by 94% within 18 months ;

E N D
Stronger Smarter: From Hope to Expectation 6 August, 2014 Dr Chris Sarra www.strongersmarter.com.au www.twitter.com/chrissarra www.wordpress.com/chrissarra
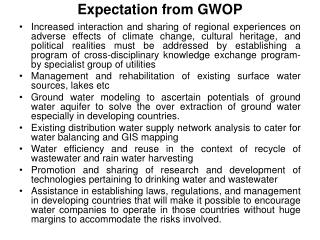
Effects of the Stronger Smarter Approach at Cherbourg SS • Unexplained absenteeism reduced by 94% within 18 months; • Real attendance improved from 62%in 1999 to 94%in 2004 (without touching welfare payments); • Year 7 diagnostic reading tests went from0% at state average in 1998, to 81 % (n=17) at state average in 2004, (remaining 20% (n=4) just below average); and • 58% improvement in Year 2 Literacy within 2 years. • 5 Aboriginal teacher aides completed teacher training while studying and continuing to work at the school • “We didn’t go to Cherbourg and give the children a sense of being Strong and Smart. • That was inside them already..... • That sense of being strong and smart resides in every Aboriginal and Torres Strait Islander child” • Dr Chris Sarra
The Stronger Smarter Philosophy • The Stronger Smarter philosophy honours a positive sense of cultural identity, acknowledges and embraces positive community leadership, enabling innovative and dynamic approaches and processes that are anchored by high expectations relationships. High expectations relationships honour the humanity of others, and in so doing, acknowledge one’s strengths, capacity and human right to emancipatory opportunity. • … Doing things WITHpeople… not TO them!
The Stronger Smarter Philosophy • Acknowledging, embracing and developing a positive sense of identity • Which Aboriginal or Torres Strait Islander Identity do your attitudes, beliefs and behaviors collude with? • Stronger Smarter V negative stereotype (Perceptions) • … Doing things WITHpeople… not TO them!
Perceptions of Aboriginal students Lazy Underachievers Shy Dirty Disobedient Aggressive High Absenteeism Cheeky Defiant Artistic Sporty Family Oriented Poor Health Do I collude with this or... smash it? What do Aboriginal students do?
The Stronger Smarter Philosophy • Acknowledging and embracing positive Indigenous leadership in communities • Being the victim (low expectations collusion with –ve stereotype) • Booting the victim (low expectations collusion with –ve stereotype) • Beyond the victim (HIGH expectations collusion with STRONGER SMARTER) • … Doing things WITHpeople… not TO them!
The Stronger Smarter Philosophy • Acknowledging and embracing positive Indigenous leadership in communities • ) • … Doing things WITHpeople… not TO them!
The Stronger Smarter Philosophy • … Doing things WITHpeople… not TO them!
Does our professional rhetoric match our day to day reality? We are committed to providing quality education outcomes for ALL children... Unless they’re black! ... Effective learning and teaching shapes and responds to the social and cultural context of the learner.... ... Shaping and responding... or blaming? What is the social and cultural context? Understanding the baggage students carry.... Understanding the baggage WE carry...
Making this personal? Shifting the question from ... What do we do with this child? To.. What would I want done if this was my child?
Tullawong State School, Queensland • Increased enrolments from 79 Indigenous students in 2008 to 137 Indigenous students in 2012. This represents a 43% increase in Indigenous enrolments over a 4 year period • Indigenous students outperformed non-Indigenous students when compared to the nation on 2011 Naplan testing • Behaviour data: • 36% reduction in the total number of referrals to the Student Support Centre • 36% reduction in suspensions between 2010 and 2012 • 11% reduction in unexplained absences between 2010 and 2012 “Attending the Stronger Smarter Leadership program was the most influential professional development I have undertaken in 25 years of working in education. It made me aware of how important my role was within the school setting, made me ‘stronger and smarter’ which has led to improved student outcomes. It allowed me to reflect on my leadership style and confirmed how important the engagement of the community is.” Scott Pacey, Deputy Principal
Bairnsdale Secondary College, Victoria • In 2001 virtually no Indigenous students were going on to years 11 and 12. Inter-racial fights were an every-day event. Today, segregation is a thing of the past. Interactions with families are no longer hostile. Indigenous students in the school have a more positive sense of their identity, few students are disengaged and the school has had its first Indigenous School Captain. • In 2011, enrolment of Koori Students increased by 80% • Koori Student attendance rates leapt from 21% to 85% • 100% Koori student retention across to year 11 and 12 for three years in a row • Year 9 and 10 Indigenous academic results improved • Numerous Indigenous students have improved their literacy skills by the equivalent of three year levels since 2008 • Suspensions and class exits have plummeted “We shut the gap on suspensions. We had good relationships with their parents. We sustained it. We cracked through a culture that had to go, that will never return. Stronger Smarter is with me, and it doesn’t matter where I’m working. You become an ally and an advocate wherever you are. I hope I push the boundaries a little bit in the schools that I work with.” Former Principal, Graham Blackley, Winner, Ministers Award for Excellence in Teaching or Leadership in Aboriginal and Torres Strait Islander Education
GlenroiHeights Public School, New South Wales School processes, curriculum planning and classroom teaching all reflect increased emphasis on community relationships and childrenʼs positive identity. Projects have succeeded through consultation and knowledge sharing with the Indigenous community. Parents come into the school to talk about learning, not discipline. The community have recognised the difference and approve of the shift towards high expectations. Elders are regular visitors and actively support a range of student activities. Attendance • Aboriginal attendance increased from 77% in 2007 to 90% in 2011 Aboriginal student suspension • 2007 - 274 days lost to learning: 161 to noncompliance, 113 days to violence • 2011 - 13 days lost to learning: all noncompliance, no violence Growth in learning outcomes for every Aboriginal student • 2011 - NAPLAN data highest of all like schools in all areas in year 3 • Personalised Learning Plans (PLP) for every student • 93% attendance of Aboriginal families at PLP meetings “Over the years Stronger Smarter has been the essence of all our school cultures and will continue to be so. The leadership and facilitator training have been the most powerful professional learning many of us have participated in… we eat and breathe the philosophy of Stronger Smarter!” Former Principal, Jane Cameron
West Arnhem College, Northern Territory • Indigenous student attendance: Jabiru 45% in 2010 to 79% in 2012; Gunbalanya – 24% in 2010 24% to 69% in 2012 • Significant improvements made for Year 3, 7 and 9 across all measurable indicators since the introduction of the ‘Strong Start Bright Future’ framework through the College model • NAPLAN2008 to 2012 across each year level (excepting year 5 numeracy) show mean score improvement, in some cases by over 100 points for Indigenous students across both campuses • Vocational Education Training 100% of 2012 Year 12 Indigenous students in the College employed, or University options after graduation • Year 12 retention: 22% in 2010 to 100% in 2013 • Indigenous employees: Jabiru Campus - 5% in 2010 to 35% in 2013; Gunbalanya - 75% in 2013 • Community involvement has resulted in a local decision to change the school calendar - start 3 weeks early in January and extend dry season break to 6 weeks, plus construction of a Residential campus in Jabiru for Indigenous students “The Stronger Smarter Leadership Program has challenged me to look within myself as a unique cultural being in order to understand others. As a result, I have been provided the skills to work inclusively with our students and our community to maintain the intricate balance between school and community, culture and knowledge. I have been able to develop our workplace culture that enables people to work more effectively together to create, innovate, take risks, challenge and be challenged.” John Bray, Senior Director
Broome Senior High School, Western Australia • Indigenous student attendance: 76% Indigenous student attendance in 2012 • 100% retention rate of Aboriginal students from Year 8 in 2007 to Year 12 in 2011 • 2011: 19 of 20 (95%) Aboriginal students graduate Year 12 • 2012: 30 Aboriginal students graduate Year 12 Fitzroy Valley District High School, Western Australia • Indigenous student attendance: Improved attendance due to reduction in student suspension from 580 in 2010 to 150 in 2012. • 20%of school staff (FTE) are Indigenous, and a priority for professional learning
Dawul Remote Community School, Western Australia • Indigenous student attendance: 94% student attendance in 2012 • 73%of school staff (FTE) are Indigenous, and a priority for professional learning • 70% of students in numeracy and 41% in reading were above national minimum standards La Grange Remote Community School, Western Australia • Indigenous student attendance: Secondary student attendance increased from 70% in 2011 to 75% in 2012 Muludja Remote Community School, Western Australia • Indigenous student attendance: 83% student attendance in 2012, significant growth over the past 2 years
Kalumburu Remote Community School, Western Australia • From 2 Aboriginal staff in 2010 to 14 Aboriginal staff currently employed Looma Remote Community School, Western Australia • 52% of school staff (FTE) are Indigenous, and a priority for professional learning • 91% staff retention in 2012 compared to 64% in 2011 Wyndham District High School, Western Australia • Staff retention reached 92% in 2012 • Improvement in student learning outcomes: • Year 3: 2012 cohort 83% above benchmark for reading, significantly improved from 58% in 2011 • Year 5: Strong improvement in reading with a 17% average improvement towards students meeting the benchmark. Writing results show the most significant improvement with a 36% average increase. • Year 7: 54% of students are at or above the benchmark for writing, showing a significant improvement from the previous year’s cohort where all students were below benchmark. • Year 9: 50% of the students are at or above benchmark for numeracy, spelling and language.
Derby District High School, Western Australia • 33% of school staff (FTE) are Indigenous, with the largest cohort of Indigenous teachers working in any Public School in Western Australia. • In 2011 100% Year 12 students graduated with a Western Australian Certificate of Education (WACE) • In 2012 43% of WACE graduates were Aboriginal students • In 2013 it is anticipated that 75% of WACE graduates will be Aboriginal students with the largest group of students to graduate • Staff retention: 84% in 2012 compared to 54% in 2008 (retention has not been below 73% in last five years) • Improvements in student learning outcomes: students who stay at Derby DHS are continuing to improve NAPLAN results with averages inboth Numeracy and Literacy above the national minimum average increases
www.strongersmarter.com.au www.twitter.com/chrissarra www.wordpress.com/chrissarra www.facebook.com/strongersmarter


![❤[READ]❤ Got Testosterone?: Men-Return to the Sexier, Stronger, Smarter You!](https://cdn7.slideserve.com/12924162/got-testosterone-men-return-to-the-sexier-dt.jpg)