Download
1 / 17
170 likes | 174 Views
This presentation discusses the concept of Ambiguity Tolerance (AT) in relation to the development of statistical reasoning skills in introductory statistics students. It presents empirical findings, methods, results, and implications for more effective teaching.

E N D
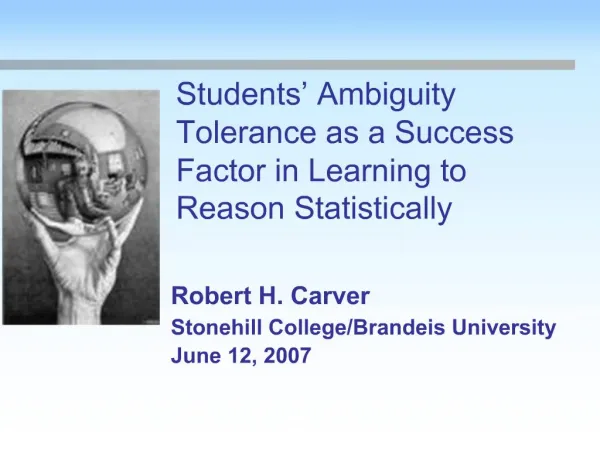
Addressing Ambiguity Tolerance Among Introductory Statistics Students Robert H. Carver Stonehill College/Brandeis University Session ST-18 DSI2007 Phoenix AZ
Outline • What is Ambiguity Tolerance (AT)? • Is it related to the development of statistical reasoning skills? • Some empirical findings • Methods • Results • Implications for more effective teaching
What is Ambiguity Tolerance (AT)? • Frenkel-Brunswik (1948) • Some are stimulatedby ambiguity, some are threatened • Personality trait vs. preferred process • Relationship to rigidity, uncertainty tolerance, openness • Enduring personality attribute vs. context-dependent
Low A.T.? High AT? “Never, ever, think outside the box”
What's the connection? Ambiguity tolerance Statistical thinking Drawing actionable conclusions based on incomplete information Methods for incorporating new information with pre-existing assumptions • When AT is low, people tend to cling to preconceived notions, reluctant to process contrary information
Statistical Thinking • Wild & Pfannkuch (1999) 4 dimensions of Statistical Thinking • Investigative (PPDAC) • Types of thinking (critical, imaginative, transnumerative…) • Interrogative (critical assessment of observations) • Dispositions (personal styles, qualities)
Common Responses to Variation Adapted from Wild & Pfannkuch, 1999
Research Questions • Is ambiguity tolerance (AT) a predictor of success in a student’s development of statistical thinking skills? • Does AT interact with other success factors? • If AT is a predictor of success, can we modify our teaching approaches to anticipate it?
Sample Sample: • 85 undergraduates enrolled over 2 semesters • Differences among sections • Technology: Minitab vs. SAS (Learning Ed.) • Ordinary, Learning Community, Honors
Methods Dependent variable: • Score on Comprehensive Assessment of Outcomes for a first course in Statistics (CAOS) post-test • Developed by Web ARTIST Project (U.Minnesota and Cal Poly) team • Pre- and Post-test (40 items each) • Note: some questions are, themselves ambiugous…
Methods Independent Measures & variables: • McLain’s AT scale: • 22 question instrument 7-point Likert Scales • Max score for extreme tolerance = 74 • Min score for extreme intolerance = - 58 • Reliability: Cronbach’s alpha = 0.897 • In this sample a = 0.872 • Did not predict performance on the pre-test
Covariates investigated • Score on CAOS Pre-test • Prior Stat Education (37% had some) • Section dummy variables (Honors, L.C., etc.) • Course Performance variables • Attendance • Gender dummy (49% female; 51% male) • First-year student dummy (61% 1st year) • Math SAT • Selected interactions with AT
Findings:CAOS Post-Test AT score has a significant effect on Post-Test reasoning score Also: evidence of interaction between AT & PreTest score Slightly Better fit with log-linear model
Discussion: If so, then what? • Need to replicate • Carolyn Dobler, Gustavus Adolphus • Jennifer Kaplan, Michigan State • Stonehill, Spring 2008 (75 students) • Recognize and Confront this variation among students • Differentiate from low effort/low aptitude/poor attitude • Re-frame the value of statistical thinking for low-AT context • Search for other personality variables with similar effects?
Final thoughts “It seems… that misconceptions are part of a way of thinking about events that is deeply rooted in most people, either as learned parts of our culture or (in the extreme) even as brain functions arising from natural selection in a simpler time.” Garfield & Ahlgren, 1988 • How shall we respond to this variation in our students? • Allow for? Control? Ignore?
Questions? Replication? • Contact me… • rcarver@stonehill.edu • rcarver@brandeis.edu • http://faculty.stonehill.edu/rcarver/