Download

1 / 62
620 likes | 854 Views
J-Shaped Distributions. Robert M. Hayes 2004. Overview. Viewing Distributions of Use Descriptive rather than Analytical Effect of Uncertainties Contexts for Library Application The Types of Distributions. Viewing Distributions of Use.

E N D
J-Shaped Distributions Robert M. Hayes 2004
Overview • Viewing Distributions of Use • Descriptive rather than Analytical • Effect of Uncertainties • Contexts for Library Application • The Types of Distributions
Viewing Distributions of Use • There are two ways to view distributions and related J-shaped curves: • (1) in sequence of increasing frequency of uses, in which the number of items is the dependent variable • (2) in sequence of increasing numbers of items, in which the frequency of use is the dependent variable
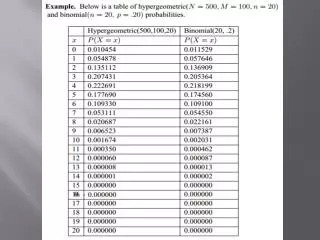
Sequence of Increasing Uses • To illustrate, consider the following distribution: • Note that the listing is in increasing order of the frequency of use. For example, there are 500 items that are used only once and 1 item that is used 10 times. The graph of this distribution looks as follows:
Example of Increasing Frequency • This way of viewing might typically be used when looking at statistics on circulation of library materials in which the number of items circulating once would be followed by the number circulating two times, etc.
Sequence of Increasing Items • The alternative picture, for the same data: • Effectively, the data are now arranged in order of decreasing frequency of use. The graphical picture is quite different:
Example of Decreasing Frequency • This means of viewing the data is typically used in applying laws such as Zipf’s law, in which words are listed in decreasing order of frequency of use. • Similarly, in the original formulation of Bradford’s law, journals are sequenced in order of decreasing productivity for a subject field and then grouped into “zones” of equal productivity (the zones containing successively greater numbers of journals).
Distributions of Use • Each of the distributions that will be presented here it intended to represent situations in which a few items (journals, scientists, users, volumes, etc.) account for the many (articles, citations, uses, circulations, etc. ). • These models have value as means for assessing the effects of the patterns upon various kinds of decisions. • In the library, those decisions might relate to acquisitions, to alternative means for storage of holdings, to staffing for services.
Descriptive rather than Analytical • It is important to recognize that, with one exception, these models are essentially descriptive of empirical data. That is, most of them do not provide explanation for the behavior exhibited in the data; they merely represent that behavior in a mathematical form. • Furthermore, they do not represent “cause and effect” relationships. • The one exception is the "mixture of Poissons" which does provide an explanation for the behavior, deriving it from the assumption of a heterogeneous (i.e., mixed) population and random processes around the average for each of the components of the population.
Effect of Uncertainties • It is also important to recognize that the empirical data, in any real situation, are themselves uncertain, subject to variation as a result of many factors—errors in observation, changes from one time period to another, changes in the mixtures of populations involved, changes in the context of observation. As a result, whatever model may best fit needs in analysis is the one to be used, since any of the models is likely to be as accurate as any other. • Furthermore, unlike physical phenomena, patterns of usage reflect not underlying laws of nature but the effects of individual decisions or, in many cases, large scale policy decisions.
Contexts for Library Applications • For the library, there are four contexts in which these kinds of distributions seem relevant: • (1) the context of the users, • (2) the context of the use of materials, • (3) the interaction between users and materials, • (4) the context of bibliometric analysis. • The first usually shows a distribution of uses across the set of users that exhibits a J-shaped curve. • The second usually shows a distribution of uses across the set of materials that also exhibits a J-shaped curve. • The third helps to identify the nature of uses. • The fourth helps in assessing contributions of journals to publication and use of the articles they contain.
Library User Patterns • Library users differ in their relative frequency of use. For example, in academic libraries, faculty will, on average, use the library much more frequently that will students. And among students, graduate students will, on average, do so more frequently than undergraduates. • The following shows relative use at the UCLA library:
Library Collection Use Patterns • Turning to the second context—the use of materials—again the evidence is that in the library the extent to which materials are used varies greatly. Considering circulation data as a measure of use, some library materials are heavily circulated each year and some are virtually never circulated. • Leaving aside for the moment differences for specific items, there are categories of items that almost by definition will vary in their circulation. There are materials that are put "on reserve" precisely because they are expected to be heavily circulated. There are rare books that will never be circulated and even will rarely be used at all. There are current "best sellers" that will be heavily used, and there are "dusty old volumes" that will almost never be used.
Library Collection Use Patterns • Beyond that, though, are the differences among items, independent of identified categories. Some of those differences relate to date of publication or acquisition, some to the subject matter, some to the changeable role as assigned readings. Despite excellent efforts (thinking especially of that by Fussler and Simon) to identify reasons for such differences, there are no easy criteria for a priori identification of which items will be heavily used and which rarely so. The differences therefore usually need to be identified from actual experience, as exemplified in circulation records.
Relationship between Users & Materials • Beyond the separate distributions for users and materials, there are also important distributions that reflect the relationships between the two. • To illustrate, the following shows the relative use of two categories of materials (items with one use and all other items) by categories of users at UCLA: • Note the relatively greater use by faculty of “One Use” items, especially in comparison with “All Others”.
Bibliometric Patterns • A number of models (such as “Bradford’s law”) are used to describe characteristics of the literature. For example how is the literature on a particular subject scattered or distributed in the journals? • For libraries, the significance lies in the fact that, in a bibliography on any subject, there is always a small group of core journals that account for a substantial percentage (say 1/3) of the articles on that subject. Then there is a second, larger group of journals that account for another third while a much larger group of journals picks up the last third.
Bibliometric Patterns • Distribution frequencies of the Bradford type are also evident in other bibliometric phenomena. Lotka’s law, for example, describes the productivity of scientists within a given population. Productivity is defined here as the number of papers a scientist publishes within a given time. • Underlying the J-shaped curve is an assumption that, if an individual (scientist or journal) is successful (writes or publishes an article) on one attempt, the probability of success on subsequent attempts increases. • This has been called "cumulative advantage" equivalent to "success-breeds-success".
The Types of Distributions • Negative Exponential Distributions • Bradford's Law - 1 • Negative Power or Harmonic Distributions • Zipf's Law • Bradford’s Law - 2 • Lotka's Law • Pareto Law • Cumulative Advantage Processes • Mixture of Poisson Distributions • Negative Binomial Distributions • Logistic Distributions • Linear Distributions
Negative Exponential Distributions • The negative exponential is represented by the equation F(k) = N*2(-A*k). • There are two characterizing parameters: N and A • The base for the exponential can be other than 2. It could be e or 10 or any other positive number. The choice of base simply affects the value of A. • For example, if the base were 10, F(k) = N*2(-A*k) = N*10(log10(2))*(-A*k) = N*10(-A*log10(2))*(k) so A is replaced by A*log10(2)
Negative Exponential Distributions • Graphically, it looks as follows, for N = 1000 and A = 1:
Bradford's Law - 1 • Samuel C. Bradford first formulated his law in 1934. But it did not receive wide attention until publication of his book, Documentation,in 1948. • Bradford called it the law of scattering, since it describes how the literature on a particular subject is scattered or distributed in the journals. • In information science, Bradford’s law is perhaps the best known of all the bibliometric laws. A huge body of literature has been written on it. • "Bradford’s law,” as originally defined, is a negative exponential distribution.
Initiation of Bradford's Law • In Documentation, Bradford analyzed a four-year bibliography of references to articles in applied geophysics. He listed journals containing references to that field in descending order of productivity. • He then divided the list into three “zones,” each containing roughly the same number of references. Bradford observed that the number of journals contributing references to each zone increased by a multiple of about five. Specifically, the first zone contained nine journals which contributed 429 references. The second contained 59 journals producing 499 references. In the third zone 258 journals provided 404 references.
Bradford S C. Documentation. Washington, DC: Public Affairs Press, 1950.
Qualitative Form of Bradford's Law • On the basis of these observations, Bradford wrote, “the numbers of periodicals in the nucleus and succeeding zones will be as 1, n, n2, … (p. 116). For applied geophysics then, the number of journals in each zone was proportionate to 1, 5, 25, … • Given that, the average frequency of use for journals in across the zone is represented by a negative exponential distribution: 1, 1/n, 1/n2, … • Later, we will derive this negative exponential distribution from an underlying negative power distribution.
Log-linear Form • Given that the negative exponential is represented by the equation F(k) = N*2(-A*k). note that log2(F(k)) = log2(N) – A*k. • This “log-linear” form is useful for plotting the values of log2 F(k) as a function of k or for estimating the values for N and A by regression. • The following graph shows the log-linear form.
Log-linear Form • Graphically the log-linear form looks as follows:
Negative Power or Harmonic Distributions • The negative power or harmonic distributions derive from the harmonic series: 1, 1/2, 1/3, … , 1/n, … • That basic series is augmented with two parameters, A and B, in the following formula: P(x) = (A/x)*(B/x)A defined over the interval 0 < B < x. • Note that P(x) is expressed as a negative power of the value x. Hence, “negative power distribution”.
Harmonic or Negative Power Distributions • Graphically it looks as follows, for a = 1.2 and b = 0.7
Zipf's Law • In his book Human Behavior and the Principle of Least Effort, George K. Zipf treated the frequency with which words occur in a given piece of literature. Zipf arranged the 29,899 different words found in Joyce’s Ulysses in descending order of their frequency of occurrence. Then to each word he assigned a rank, from r = 1 (most frequently occurring word) to r = 29,899 (least frequently occurring). He found that by multiplying the numerical value of each rank r by its corresponding frequency F, he obtained a product, C, which was constant throughout the entire list of words. • The formula for Zipf’s law is thus F(r) = C/r, so it is a harmonic distribution.
Bradford's Law - 2 • At about the same time thatZipf published his book, Bradford wrote Documentation. • We have already discussed the negative exponential distribution represented by the original formulation of Bradford’s law. • We will now look at the underlying harmonic distribution and derive the exponential one from it.
Frequency of Use of Journals • Underlying Bradford’s law is the frequency of use of journals, as exemplified by their occurrence in a bibliography for a subject field. • Let P(n) be the frequency of use of journal (n), listed in decreasing order of that frequency of use, so that P(n) > P(n+1). • The empirical facts appear to be that, overall and with varying degrees of accuracy, the frequency of use of journals fits an harmonic distribution. • Thus, P(n) = A/n (more or less)
Frequency for Groups of Journals • Suppose that we now group the journals, the first group containing the most frequently used journals, the second the next most frequently used, and so on. • Let Gk be the number of journals in group k. • Consider the frequency of use of the journals in each of the several groups: F(1) = P(1) + P(2) + … + P(G1) = 1/1 + 1/2 + … + 1/ G1 F(2) = P(G1+1) + P(G1+2) + … + P(G1+G2) = 1/ (G1+1) + … + 1/ (G1+G2) F(3) = P(G1+G2+1) + … + P(G1+G2+G3) = 1/ (G1+G2+1) + … + 1/ (G1+G2+G3) and so on.
Sums of the Harmonic Series • There is not a closed form for evaluation of the several sums of an harmonic series, but we can compare the total for the areas of the rectangles with the integral of the function 1/x, shown in red in the following graph:
Harmonic Series & Natural Logarithm • The sum from 1/(A+1) to 1/B can be approximated by the integral of 1/x from (A + 1 - 0.5) to (B + 0.5). • The integral of 1/x is ln(x), so the sum from 1/(A+1) to 1/B would be approximately ln ((B + 0.5)/(A + 0.5)) • Use that approximation and let Tk = Gi , T0 = 0 so that F(k+1) = ln ((Tk+1 + 0.5)/(Tk + 0.5)) • In Bradford’s description of the law, the successive groups of journals were chosen to have about the same number of citations, so F(1) = F(2) = F(3) = F(4), etc. • Hence, (Tk+1 + 0.5)/(Tk + 0.5) = (Tk + 0.5)/(Tk-1 + 0.5) (Tk + 0.5)2 = (Tk+1 + 0.5)*(Tk-1 + 0.5) = (Tk + 0.5 + Gk+1 )*(Tk + 0.5 - Gk) = (Tk + 0.5)2 + Gk+1*(Tk-1 + 0.5) – Gk*(Tk + 0.5)
Harmonic Series & Natural Logarithm • From that equation, Gk+1= Gk*(Tk+ 0.5)/(Tk-1 + 0.5) • For k = 1, G2 = G1*(G1 + 0.5)/(0 + 0.5) = G1*(2G1 + 1) • By induction, we prove that Gk+1 = G1*(2G1 + 1)k: • First, if Gi= G1*(2G1 + 1)(i – 1) for all i < k + 1,then Tk = G1*i(2G1 + 1)i = G1*((2G1 + 1)k – 1)/(2G1 + 1 – 1) = ((2G1 + 1)k - 1)/2 = (2G1 + 1)k/2 - 0.5 • Hence, Tk + 0.5 = (2G1 + 1)k/2 and Tk-1 + 0.5 = (2G1 + 1)(k-1)/2 • Hence, since Gk+1= Gk*(Tk+ 0.5)/(Tk-1 + 0.5), Gk+1= Gk*((2G1 + 1)k/2)/((2G1 + 1)(k-1)/2) Gk+1 = G1*(2G1 + 1)k • Q.E.D.
Harmonic Series & Natural Logarithm • As a result, the number of journals in group k is an exponential function of k. Given the equal number of citations for each group, the frequency distribution is negative exponential. • However, it is important to note that the approximation of the summation of 1/n by ln is significantly in error at the start. Specifically, 1/1 = 1 but ln (1.5/0.5) = 1.1. • The result is over-estimate at the start by about 10%. • This is at least a partial explanation of the difference between empirical data and the exponential model in the region called “the core journals” which will be illustrated next.
Graphical Form of Bradford's Law • The following graph illustrates Bradford’s law for articles on tropical and subtropical agriculture found in Tropical Abstracts during 1970. • Note that the x-axis is the logarithm of the number of journals and the y-axis is the number of citations. • The data-points on the graph are equally spaced on the y-axis and logarithmically spaced on the x-axis. • In preparing graphs related to the prior discussion, the x and y axes would be reversed so as to represent the log (number of journals) as a function of k, the number of groups of journals.
Lawani, S. M. “Bradford’s law and the literature of agriculture”. Int.Lib. Rev. 5:341-50, 1973,
Anomalies in Bradford's Law • Notice that the empirical data initially appears as an upward curve before it becomes linear. This is typical of Bradford graphs. The area represented by the curving line is usually regarded as the “nuclear zone,” or journal core. • Notice also that the empirical data begins to droop at about the 250th journal. The droop consistently appears among many different sets of empirical data. • One theory is that including more journals would maintain the linearity. Another theory is that the droop is an integral part of article scatter. • Later, when we look at the logistic distribution, we will consider a third explanation.
An Interpretation of Bradford's Law • In 1967, Ferdinand F. Leimkuhler, Purdue University, proposed an equation for representing Bradford’s law: F(x)= ln((1 + bx)/(1 + b)), where x denotes the fraction of documents in a collection which are most productive, 0 < x <1. • This is similar to the formula that has been presented above. • F(x) denotes the proportion of total productivity contained in the fraction x. The parameter b is related to the subject field and the completeness of the collection. • Leimkuhler, F F. The Bradford distribution. J. Doc. 23:197-207, 1967.
A Second Interpretation • But the next year, Brookes complained that the formula required too much tedious computation to be of practical use to librarians. “In fact,” wrote Brookes, “it was the exasperation evoked by an attempted practical application of Leimkuhler’s formulae” that led him to seek a simpler formulation of the Bradford distribution. Brookes’ formula: R(n) = k log n/s, where R(n) denotes the number of relevant papers contributed by the journal ranked n. k is a constant which determines the slope of the Bradford curve and is related to the document collection. s is a constant which determines where the straight line, if extended, would intersect the horizontal axis.
A Third Interpretation • Elizabeth A. Wilkinson, University College, London, suggested, in 1972, that the formulas provided by Leimkuhler and Brookes did not really describe the same phenomenon. The discrepancy arose from an error that Bradford himself had made. • Bradford provided both a graphical representation of his applied geophysics data, and the verbal expression of his law previously quoted in this essay. • Wilkinson observed that Leimkuhler had derived his distribution function from Bradford's verbal expression, while Brookes derived his formula from Bradford’s graphical representation. In comparative tests, she found that the graphic formulation more closely conformed to empirical data than the verbal expression in six of eight cases.
Lotka's Law • Distribution frequencies of the Bradford-Zipf type are also evident in other statistical phenomena. Lotka’s law, for example, describes the productivity of scientists within a given population. Productivity is defined here as the number of papers a scientist publishes within a given time. In 1926, Alfred Lotka observed that the distribution of scientific authorship follows an inverse square formula. That is, the number of scientists who author n papers will be 1/n2 of those who author just one paper. Thus, for every 100 authors who produce just one paper, 25 will produce two, 11 will produce three, and so on. At least one study has shown that Lotka’s law also applies to the humanities literature. • Murphy, L J. Lotkas law in the humanities? J. Amer. Soc. Inform. Sci. 24:461-2, 1973.
Lotka's Law • In his classic book Little Science, Big Science, Price noted that Lotka’s simple inverse square formula tends to overestimate the number of high-productivity authors. In fact, the number of people within the highest productivity range falls off more nearly by the inverse cube, rather than the inverse square. Price also observed similarities between Lotka’s law and Pareto’s law of income distribution, which states that cumulative figures for income follow a l/n1.5 law. • Price, D. J. D. Little science, big science. New York: Columbia, 1963, 118 p., p. 49
Cumulative Advantage Processes—"Success breed Success" • Price describes his “theory of cumulative advantage processes” as having a single-edged Matthew effect, i.e., success is rewarded but failure has no consequences. Price provides a formula to describe a population of individuals trying to achieve a goal. • In the case of Lotka’s law, the individual is a scientist, and the goal is publication of a paper. • In the case of Bradford's law, the individual is a journal, and the goal is to be read. • In either case, if an individual (scientist, journal) is successful (publishes, yields an article that is read) on one attempt the probability of success on subsequent attempts increases.
Pareto Distribution • The Pareto distribution is represented by the formula: f(x) = (a/b)[b/(b + x)](a-1), x > b • The Pareto distribution is named after Vilfredo Pareto, an Italian economist, who around 1900 determined that the majority of the world's wealth was held by a minority of the people. • This is not news to us today, but was a revelation then. • The format in which Pareto presented his data was a bar graph sequenced in descending order of wealth, and it was a J-shaped distribution.
Pareto Distribution • In the 1920's, the Pareto distribution was applied to quality control to show the frequency with which each cause of problems had occurred. • The result again was a J-shaped curve, implying that most problems in quality result from a small number of causes. It is valuable as a tool in determining the most frequent causes of a particular problem and deciding where to focus efforts for maximum effectiveness.
Pareto Distribution • The Pareto distribution became known as the 80-20 rule: 80% of whatever may be involved is related to 20% of the potential sources. In practice, the percentages may not be always exactly 80/20, but there usually are "the vital few and the trivial many." • A Pareto chart combines a bar graph with a cumulative line graph. The bar graph shows the values in the descending order from left to right, with bar height reflecting the frequency or impact of problems. The cumulative sum line shows the percent contribution of all preceding bars.