Download
1 / 9
90 likes | 192 Views
GeoTools 2009 Conference A Process For Mapping Shorelines and Intertidal Zones With Multitemporal LANDSAT 7 Images. Process input: a series of LANDSAT images; E.g., 20 images over a 2 year span.

E N D
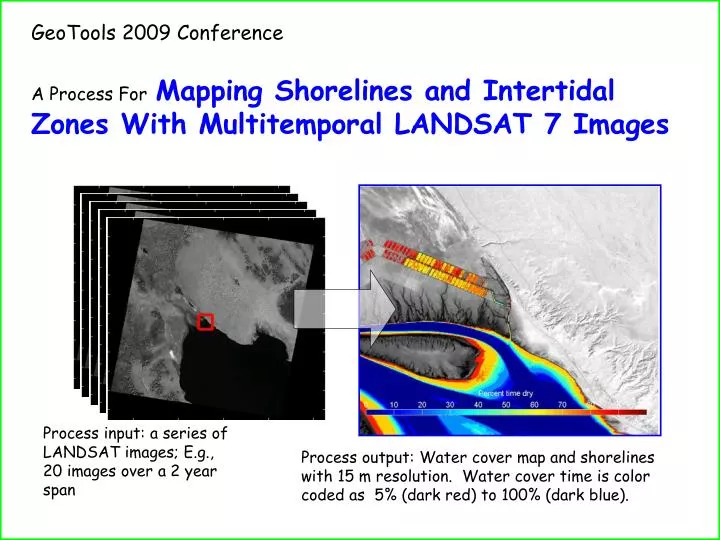
GeoTools 2009 ConferenceA Process ForMapping Shorelines and Intertidal Zones With Multitemporal LANDSAT 7 Images Process input: a series of LANDSAT images; E.g., 20 images over a 2 year span Process output: Water cover map and shorelines with 15 m resolution. Water cover time is color coded as 5% (dark red) to 100% (dark blue).
Processing Algorithm Max/min water cover based on MWIR Reference image Multitemporal set of LANDSAT bands 4 ,5, & 8 Coarse resolution water cover based on NIR & SWIR Subpixel registration Denoise Radiometric scaling (Pan band) Refined radiometric scaling for Pan band Pan sharpened shorelines Coarse shorelines Water cover map and shorelines
Benefits of LANDSAT 7 relative to other satellites • LANDSAT has the most revisits in archive. Worldwide 16-day revisits since 1999*. This is essential to any sort of multitemporal analysis. • LANDSAT’s eight spectral bands includes the three most suitable for mapping water bodies - SW, MW, and Thermal IR bands • And since late 2008 the entire inventory of LANDSAT imagery has been made available free with electronic downloads. This makes multitemporal analysis affordable. * In archived data the revisit time is variable, average ~1/month; LANDSAT 5 images also available, going back to 1984.
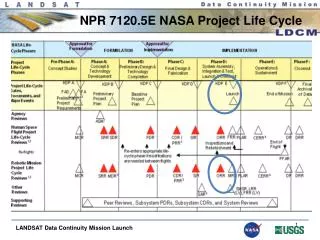
Comparison of various satellites For a hypothetical project requiring 20 Pan+MSI images over 10-year span, 400 km2 area centered on El Golfo De Santa Clara (31.98N,114.95W)
Mouth of the Colorado River at the North end of Gulf of California. Part time aquatic farm activity Bathymetry in the intertidal zone
Process runs on a dedicated server User logs on the server jk server Remote user Images are downloaded directly from USGS portal to the jk server Access to the server is free. Instructions for logging on can be found at jOmegak.com/jCube/. Contact: Ron Abileah abileah@jOmegak.com USGS LANDSAT portal
Part of the shoreline in North Gulf of California semi-dry lake 2 km wide intertidal zone, tidal rivers
Vicinity of the San Mateo Bridge (San Francisco Bay) Protected wetlands covered with water approximately 30% of the time.
4 images from 2000 and 4 from 2008 were combined to show the 8-year change (green) in the Dead Sea shoreline