Download
1 / 46
480 likes | 707 Views
Implementation Planning & Scheduling. Tools for Project Scheduling. Gantt Bar & Milestone Charting Critical Path Method Project Scheduling Software. Today, we ’ ll focus on Gantt/Bar & Milestone Charts and their Integration with: The Critical Path Method (CPM). These are recognized

E N D
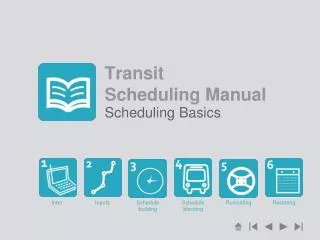
Tools for Project Scheduling • Gantt Bar & Milestone Charting • Critical Path Method • Project Scheduling Software
Today, we’ll focus on Gantt/Bar & Milestone Charts and their Integration with: The Critical Path Method (CPM)
These are recognized “Best Practices” advocated by the international Project Management Institute
Gantt (Bar) Chart Activity ID Number – Can be WBS Levels TIME SCALE for Scheduling Activity — to do — Task List
Activity An element of work that is required by the project, uses resources, and takes time to complete.
Activity May be subdivided into smaller tasks.
Estimating Performance & Reporting Progress During Implementation Team Exercise 1
Project “X”Gantt/Bar Chart As of Date Actual Performance Reported PLAN Activity • PREPARE PROGRESS REPORT: • 1) What is the project’s overall implementation status? • 2) Is the project “On” “Ahead” or “Behind” Schedule ? • 3) If Ahead or Behind, by how much? A B C D Project Summary How would you summarize overall performance?
Estimating Performance & Reporting Progress During Implementation With a project plan based only on a Bar/Gantt chart, there is usually insufficient information to properly assess implementation status • Planners do not usually implement projects • Milestones are not usually shown, only activities • Linkages/interrelationships between activities and/or milestones are not shown • There are many different ways to calculate percentages • Bar Charts are usually only “drawings” prepared in Excel Spreadsheets, so are only “static” and difficult to update Consequently, while bar/Gantt charts look impressive for reports and briefings, they are seldom useful for actual implementation monitoring of projects
There are at least 7 Methods for Computing “Percent Complete” 1. Units Completed or Units In Place 10,000 LM estimated, 4,000 completed = 40% 2. Incremental Milestones Equipment received 20% Equipment Set 15% Alignment Complete 40% Testing Completed 15% Owner Acceptance 10% TOTAL 100% 3. Start/Finish “X”% upon start of the activity, “y”% upon completion 4. Elapsed Time Ratio Actual elapsed time compared to planned total project time
At least 7 Methods for Computing “Percent Complete” cont’d 5. Supervisor’s Opinion “Educated Guesstimate” of % complete 6. Cost Ratio Actual Cost in $$ or Manhours to date/Estimate at Completion 7. Weighted or Equivalent Units Weight Subtask U/M Quantity Actual Earned 02% Install Bolts Each 200 200 10.4 02% Shim & Level % 100 100 10.4 05% Shake-Out % 100 100 26.0 06% Set Columns Each 87 74 27.5 11% Install Beams Each 859 45 3.0 10% Install X Braces Each 837 0 0 20% Install Girts & Sag Rods Bay 38 0 09% Plumb & Align % 100 5 2.3 30% Connections Each 2977 74 3.9 05% Punch list % 100 0 0 100% Erect Steel Totals Ton 520 N/A 83.5 83.5 tons/520 tons = 16.1% complete 8. Do You have another different method . . . ?
The Flood Control Project Manager reported the project: “99.17 percent complete” City Chief Engineer: “seeing the project physically, I can say the report is incorrect.”
Malabon execs, residents set to picket DPWHBy Jerry Botial The Philippine STAR METRO Friday June 27 2008 Malabon Mayor Canuto Oreta, the city’s flood advisory council and prominent residents threatened yesterday to stage a series of mass actions to protest an announce-ment by the Department of Public Works and Highways (DPWH) that it will need another year to finish the Camanava flood control project. . . . Oreta said the people are outraged as they have long been calling for the immediate completion of the project, which started on June 10, 2003 should have been finished on June 4, 2007. The completion date was moved to Sept. 4 this year, as reported by project manager Carla Bartolo in her monthly progress report dated May 25, 2008. Last Wednesday, she confirmed to The STAR that the revised completion date has been moved anew to September 2009. . . . Bartolo had reported that the flood control project is “99.17 percent complete” but Oreta, an engineer, described the figure as “ridiculous”. . . [Malabon’s chief engineer, Ruth Senaida] said “seeing the project physically, I can say that her report is incorrect.”
Which brings us to a significant improvement in project performance monitoring & reporting: MILESTONES !
“Milestones” In Project design & monitoring, Milestones can be identified and used as Checkpoints for Schedule&/or Technical Performance
Gantt (Bar) Chart with Milestones Activity ID Number – Can be WBS Levels TIME SCALE for Scheduling Milestones for specific checkpoints in the project Performance process Activity — to do — Task List
Project “X” PLAN Gantt/Bar Chart with Milestones, & showing interdependencies PLAN Activity A B C D Project Summary
Project “X” ACTUALGantt/Bar Chart with Milestones, & showing Implementation Performance • PROGRESS REPORT • Total Project 15Milestones Planned; 5 Completed. Overall Progress 5/15 = Project is 33% Complete • 5 Milestones were scheduled to date; 5 completed. 5/5 = Project is ON Schedule = Completed MS As of Date PLAN Activity A B C D Project Summary
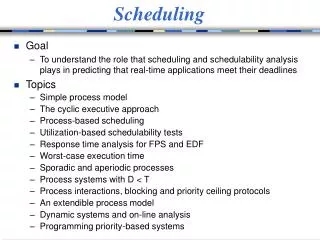
Steps in Critical Path Networking • Identify Outputs (Deliverables) • Identify Activities/Tasks needed to produce Deliverables • Sequence Activities/Tasks • Simple — strictly sequential • Complex — parallel, interrelated / interdependent
AoA -- Activity-on-Arrow Network Activities (Tasks) are represented by Arrows, and Start/Stop Milestones by Nodes or Boxes MILESTONE MILESTONE MILESTONE ACTIVITY ACTIVITY
CRITICAL PATH METHOD – (CPM) NETWORK MILESTONE MILESTONE ACTIVITY Sequential Logic: What activities must be done after? What activities must be done before? What activities can be done concurrently?
Network Diagramming – Rules of Thumb • There is a starting point • There is an ending point • There are predecessors for all activities (except the first) • There are successors for all activities (except the last) • There are no loops • The logic is updated • The network must be kept current
Steps in Scheduling • Identify Outputs (Deliverables) • Identify Activities/Tasks needed to produce Deliverables • Estimate Time Durations for Activities/Tasks • Sequence Activities/Tasks • Simple — strictly sequential • Complex — parallel, interrelated / interdependent 0 11 3 6 11 3 5 4 2 6 Calculate the Critical Path — cumulative addition
Calculating a Network, & Showing the Critical Path[Forward Pass]Identifies the Earliest Time a Milestone can be completed
Calculating a Network, and Showing the Critical Path 5 3 2 5 1 3 D 0 3 8 10 B 6 2 A F G 2 10 2 8 6 5 5 1 2 E C 2 6
Arrow Diagramming For concurrent activities in an “Activity-on-Arrow” Network that start from the same milestone and would otherwise finish at a same ending milestone,use an additional “0 duration” “Dummy Activity” and an additional Milestone – to help clarify computation. A Dummy activity has no duration and uses no resources. It is simply a means to indicate the sequential relationship.
Steps in Scheduling • Identify Outputs (Deliverables) • Identify Activities/Tasks needed to produce Deliverables • Estimate Time Durations for Activities/Tasks • Sequence Activities/Tasks • Simple — strictly sequential • Complex — parallel, interrelated / interdependent • Calculate the Entire Network to Determine the Critical Path • CHECK • End Completion/Delivery date • Logic Sequences & Interdependencies between Activities/Tasks • Refine —Eliminate, Combine, Rearrange, Simplify
Critical Path • The series of interdependent activities in the project with the longest cumulative duration. • The series of activities that determine the shortest time to complete the project.
TEAM EXERCISE Calculate a Critical Path for an interrelated Project Network
3 3 C F B 2 4 5 5 4 1 1 A E 4 Calculate a NETWORK Critical Path Based on its Earliest Activity Times D H 3 J Z 2 6 3 4 G I NOTE: Handout a copy to each participant
5 2 8 11 3 3 C F 2 B 5 11 2 4 5 5 7 0 8 7 4 16 16 19 8 4 4 1 5 1 A E 4 Calculate a NETWORK Critical Path Based on its Earliest Activity Times 12 D H 3 19 J Z 2 6 8 2 9 3 6 4 6 2 G I
Time Scaling a Network and Showing the Critical Path 5 3 2 1 D 3 8 0 B 2 10 A F G 2 2 6 5 1 2 E C B D F G A C E Slack / Float 0 1 2 3 4 5 6 7 8 9 10
Time Scaling a Network and Linking it to a Gantt / Bar Chart 5 3 2 1 D 0 3 B A 10 8 2 2 6 2 1 G F 5 Activity 2 E C AB AC BC BD CE DF EF FG 0 1 2 3 4 5 6 7 8 9 10 A DC E F G B
TEAM EXERCISE Time Scaling a Project Network and Linking it to a Gantt/Bar Chart
5 2 8 11 3 3 C F 2 B 5 11 2 4 5 5 7 0 8 7 4 16 16 19 8 4 4 1 5 1 A E 4 Calculate a NETWORK Critical Path Based on its Earliest Activity Times 12 D H 3 19 J Z 2 6 8 2 9 3 6 4 6 2 G I
2 5 11 5 8 3 3 C F 2 B 11 2 4 5 5 0 7 7 8 16 16 19 4 4 8 4 1 5 1 A E 4 D H 3 19 12 J Z 2 6 8 2 9 3 6 4 2 G I 6 Time-Scale a NETWORK Based on its Earliest Activity Times NOTE: Slack - - - is After its Activity – i.e. “Hurry Up & Wait” The Critical Path is the longest series of Activities, and the shortest time to complete the process B C F A D E H Z J G I 0 1 2 3 4 5 6 7 8 9 10 11 12 13 14 15 16 17 18 19
B C F A D E H Z J G I AB BC CF BE AD DE Time-Scaled Network converted to a Gantt/Bar Chart EF EH AG GH FJ HJ GI IJ JZ 1 2 3 4 5 7 8 9 10 11 12 13 14 15 16 17 18 19 0 6
The Three Advantages of Starting with a Critical Path Network Analysis and then converting it to a Gantt / Bar Chart • Interdependencies between Activities are Identified • Critical Path Identified • Slack / Float of Activities Identified
TEAM ACTIVITYPrepare Your Project Schedule • Identify Activities & Milestones • Prepare Network diagram • Calculate the “Critical Path” & Slack/Float