Download
1 / 102
1.1k likes | 1.49k Views
Aggregate Planning. Process planning. Long range. Strategic capacity planning. Forecasting & demand management. Intermediate range. Sales and operations (aggregate) planning. Sales plan. Aggregate operations plan. Manufacturing. Services. Master scheduling.

E N D
Process planning Long range Strategic capacity planning Forecasting & demand management Intermediate range Sales and operations (aggregate) planning Sales plan Aggregate operations plan Manufacturing Services Master scheduling Material requirements planning Weekly workforce and customer scheduling Order scheduling Short range Daily workforce and customer scheduling
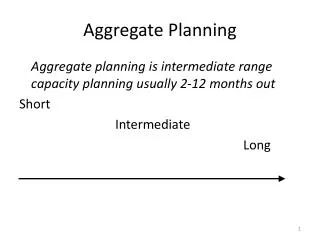
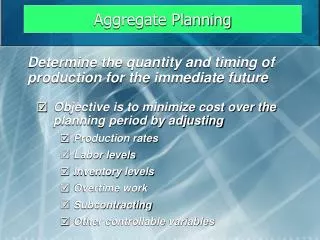
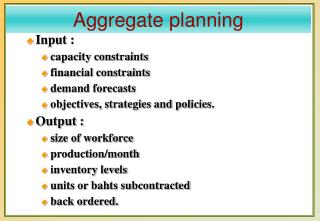
The Aggregate Operations Plan • Main purpose: Specify the optimal combination of • production rate (units completed per unit of time) • workforce level (number of workers) • inventory on hand (inventory carried from previous period) • Product group or broad category (Aggregation) • This planning is done over an intermediate-range planning period of 3 to18 months
Competitors’behavior Raw material availability Market demand External capacity Economic conditions Current physical capacity Current workforce Inventory levels Activities required for production Required Inputs to the Production Planning System External to firm Planning for production Internal to firm
Key Strategies for Meeting Demand • Chase • Level • Some combination of the two
Mixing Options to Develop a Plan • Chase strategy • Match output rates to demand forecast for each period • Vary workforce levels or vary production rate • Favored by many service organizations
Mixing Options to Develop a Plan • Level strategy • Daily production is uniform • Use inventory or idle time as buffer • Stable production leads to better quality and productivity • Some combination of capacity options, a mixed strategy, might be the best solution
Aggregate Planning Examples: Unit Demand and Cost Data Suppose we have the following unit demand and cost information: Demand/mo Jan Feb Mar Apr May Jun 4500 5500 7000 10000 8000 6000 Materials Rs5/unit Holding costs Rs1/unit per mo. Marginal cost of stockout Rs1.25/unit per mo. Hiring and training cost Rs200/worker Layoff costs Rs250/worker Labor hours required .15 hrs/unit Straight time labor cost Rs8/hour Beginning inventory 250 units Productive hours/worker/day 7.25 Paid straight hrs/day 8
Cut-and-Try Example: Determining Straight Labor Costs and Output Given the demand and cost information below, what are the aggregate hours/worker/month, units/worker, and rupees/worker? 7.25x22 Demand/mo J an Feb Mar Apr May Jun 4500 5500 7000 10000 8000 6000 Productive hours/worker/day 7.25 Paid straight hrs/day 8 7.25/0.15=48.33 & 48.33x22=1063.33 22x8hrsxRs8=Rs1408
First, calculate net requirements for production, or 4500-250=4250 units Then, calculate number of workers needed to produce the net requirements, or 4250/1063.33=3.997 or 4 workers Finally, determine the number of workers to hire/fire. In this case we only need 4 workers, we have 7, so 3 can be fired. Chase Strategy(Hiring & Firing to meet demand) Lets assume our current workforce is 7 workers.
Below are the complete calculations for the remaining months in the six month planning horizon
Below are the complete calculations for the remaining months in the six month planning horizon with the other costs included
Level Workforce Strategy (Surplus and Shortage Allowed) Lets take the same problem as before but this time use the Level Workforce strategy This time we will seek to use a workforce level of 6 workers
Below are the complete calculations for the remaining months in the six month planning horizon Note, if we recalculate this sheet with 7 workers we would have a surplus
Labor Material Storage Stockout Below are the complete calculations for the remaining months in the six month planning horizon with the other costs included Note, total costs under this strategy are less than Chase at Rs260.408.62
Chapter 15 Materials Requirements Planning
Planning for MaterialsTwo types of inventories • Two types of inventories exist in any operations system • Operating Inventory: • Denotes all the resources (broadly of material and capacity) that are available for the operating system to consume in the production process • Dependant demand attributes • Distribution Inventory: • Meant for market consumption • Independent demand attributes • They differ in their demand attributes & therefore require alternative planning methodologies
Material Requirements PlanningDefined • Materials requirements planning (MRP) is a means for determining the number of parts, components, and materials needed to produce a product • MRP provides time scheduling information specifying when each of the materials, parts, and components should be ordered or produced • Dependent demand drives MRP • MRP is a software system
Demand Characteristics Demand Characteristics for Finished Products and Their Components Dependent demand Independent demand 100 x 1 = 100 tabletops 100 tables 100 x 4 = 400 table legs 400 – 300 – 200 – 100 – Discrete demand Continuous demand 400 – 300 – 200 – 100 – No. of tables No. of tables 1 2 3 4 5 Week M T W Th F M T W Th F
Drives MRP Independent vs. Dependent Demand Independent Demand (Demand not related to other items) Dependent Demand (Derived) E(1) 6
Product Structure Record Clip Assembly (1) Rivets (2) Pressboard (1) Level 0 Clipboard Level 1 Top Clip (1) Bottom Clip (1) Pivot (1) Spring (1) Level 2 Major Inputs to MRP Process:1. Bill of Material • Product structure file • Determines which component items need to be scheduled
A B(4) C(2) D(2) E(1) D(3) F(2) Example of MRP Logic and Product Structure Tree Given the product structure tree for “A” and the lead time and demand information below, provide a materials requirements plan that defines the number of units of each component and when they will be needed Product Structure Tree for Assembly A Lead Times A 1 day B 2 days C 1 day D 3 days E 4 days F 1 day Total Unit Demand Day 10 50 A Day 8 20 B (Spares) Day 6 15 D (Spares)
LT = 1 day First, the number of units of “A” are scheduled backwards to allow for their lead time. So, in the materials requirement plan below, we have to place an order for 50 units of “A” on the 9th day to receive them on day 10.
LT = 2 Spares A 4x50=200 B(4) C(2) D(2) E(1) D(3) F(2) Next, we need to start scheduling the components that make up “A”. In the case of component “B” we need 4 B’s for each A. Since we need 50 A’s, that means 200 B’s. And again, we back the schedule up for the necessary 2 days of lead time.
27 A Part D: Day 6 B(4) C(2) 40 + 15 spares D(2) E(1) D(3) F(2) Finally, repeating the process for all components, we have the final materials requirements plan: • The McGraw-Hill Companies, Inc., 2001
A B(3) C(4) D(1) E(2) D(2) F(3) Example of MRP Logic and Product Structure Tree Given the product structure tree for “A” and the lead time and demand information below, provide a materials requirements plan that defines the number of units of each component and when they will be needed Product Structure Tree for Assembly A Lead Times A 2 day B 1 days C 2 day D 3 days E 2 days F 3 day Total Unit Demand Day 10 60 A Day 8 15 B (Spares) Day 6 20 D (Spares)
Material Requirements Planning System • Based on a master production schedule, a material requirements planning system: • Creates schedules identifying the specific parts and materials required to produce end items • Determines exact unit numbers needed • Determines the dates when orders for those materials should be released, based on lead times
30 Firm orders from known customers Forecasts of demand from random customers Aggregate product plan Engineering design changes Inventory transactions Master production Schedule (MPS) Material planning (MRP computer program) Bill of material file Inventory record file Secondary reports Primary reports Exception reports Planning reports Reports for performance control Planned order schedule for inventory and production control • The McGraw-Hill Companies, Inc., 2004
Bill of Materials (BOM) FileA Complete Product Description • Materials • Parts • Components • Production sequence • Modular BOM • Subassemblies • Super BOM • Fractional options
Inventory Records File • Each inventory item carried as a separate file • Status according to “time buckets” • Pegging • Identify each parent item that created demand
Primary MRP Reports • Planned orders to be released at a future time • Order release notices to execute the planned orders • Changes in due dates of open orders due to rescheduling • Cancellations or suspensions of open orders due to cancellation or suspension of orders on the master production schedule • Inventory status data
Secondary MRP Reports • Planning reports, for example, forecasting inventory requirements over a period of time • Performance reports used to determine agreement between actual and programmed usage and costs • Exception reports used to point out serious discrepancies, such as late or overdue orders
General Format of an MRP Report • Item Identification • Lead Time • Available Inventory • Lot size • Safety Stock • Allocated • Low-level-code: • Report date:
Period Week 1 2 3 4 5 6 7 8 • Gross Requirements • Scheduled receipts • Projected available balance • Net requirements • Planned order receipt • Planned order release
X A(2) B(1) C(2) D(5) C(3) MRP Example Requirements include 95 units (80 firm orders and 15 forecast) of X in week 10
X A(2) It takes 2 A’s for each X
X A(2) B(1) It takes 1 B for each X
X A(2) B(1) C(3) It takes 3 C’s for each A
X A(2) B(1) C(3) C(2) It takes 2 C’s for each B
X A(2) B(1) C(3) C(2) D(5) It takes 5 D’s for each B
Calculation of Order Size in MRP • Lot-for-lot Method • EOQ Method • Least Total Cost Method • Least Unit Cost Method
What is Scheduling? • Last stage of planning before production occurs • Specifies when labor, equipment, and facilities are needed to produce a product or provide a service
Scheduled Operations • Process Industry • Linear programming • EOQ with non-instantaneous replenishment • Mass Production • Assembly line balancing • Project • Project -scheduling techniques (PERT, CPM) • Batch Production • Aggregate planning • Master scheduling • Material requirements planning (MRP) • Capacity requirements planning (CRP)
Objectives in Scheduling • Meet customer due dates • Minimize job lateness • Minimize response time • Minimize completion time • Minimize time in the system • Minimize overtime • Maximize machine or labor utilization • Minimize idle time • Minimize work-in-process inventory
Shop Floor Control (SFC) • scheduling and monitoring of day-to-day production in a job shop • also called production control and production activity control (PAC) • usually performed by production control department • Loading • Check availability of material, machines, and labor • Sequencing • Release work orders to shop and issue dispatch lists for individual machines • Monitoring • Maintain progress reports on each job until it is complete
Loading • Process of assigning work to limited resources • Perform work with most efficient resources • Use assignment method of linear programming to determine allocation
Assignment Method • Perform row reductions • subtract minimum value in each row from all other row values • Perform column reductions • subtract minimum value in each column from all other column values • Cross out all zeros in matrix • use minimum number of horizontal and vertical lines • If number of lines equals number of rows in matrix, then optimum solution has been found. Make assignments where zeros appear • Else modify matrix • subtract minimum uncrossed value from all uncrossed values • add it to all cells where two lines intersect • other values in matrix remain unchanged • Repeat steps 3 and 4 until optimum solution is reached