Download
1 / 27
270 likes | 410 Views
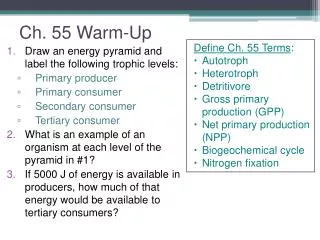
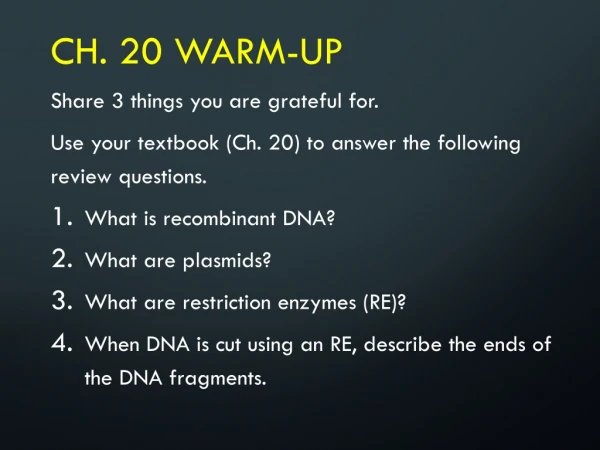
Ch. 52 Warm-Up. Define : Demography Semelparity Iteroparity Carrying capacity Exponential growth curve Logistic growth curve K-selection r-selection Ecological footprint. (Review) Sketch an exponential population growth curve and a logistic population growth curve.

E N D
Ch. 52 Warm-Up • Define: • Demography • Semelparity • Iteroparity • Carrying capacity • Exponential growth curve • Logistic growth curve • K-selection • r-selection • Ecological footprint • (Review) Sketch an exponential population growth curve and a logistic population growth curve. • What is an ecological footprint? • What are ways that you can reduce your ecological footprint?
Chapter 52 Population Ecology
Population = group of individuals of a single species living in same general area Density: # individuals / area Dispersion: pattern of spacing between individuals Introduction
Determining population size and density: • Count every individual • Random sampling • Mark-recapture method
Patterns of Dispersal: • Clumped – most common; near required resource • Uniform – usually antagonistic interactions • Random – not common in nature
Additions occur through birth, and subtractions occur through death. Life table : age-specific summary of the survival pattern of a population Represent data with a survivorship curve. Plot # of individuals in a cohortstill alive at each age. Demography: the study of vital statistics that affect population size
Survivorship Curves: • Type I curve: low death rate early in life (humans) • Type II curve: constant death rate over lifespan (squirrels) • Type III curve: high death rate early in life (oysters)
Life History: traits that affect an organism’s schedule of reproduction and survival 3 Variables: • Age of sexual maturation • How often organism reproduces • # offspring during each event Note: These traits are evolutionary outcomes, not conscious decisions by organisms
Semelparity • Big-bang reproduction • Many offspring produced at once • Individual often dies afterwards • Less stable environments Agave Plant
Iteroparity • Repeated reproduction • Few, but large offspring • More stable environments Lizard Critical factors: survival rate of offspring and repeated reproduction when resources are limited
N/t = B-D N = population size t = time Change in Population Size Change in population size during time interval Births during time interval - Deaths during time interval =
Zero population growth: B = D • Exponential population growth: ideal conditions, population grows rapidly
Unlimited resources are rare Logistic model: incorporates carrying capacity (K) K = maximum stable population which can be sustained by environment dN/dt = rmax((K-N)/K) S-shaped curve
Factors that limit population growth: • Density-Dependent factors: population matters • i.e. Predation, disease, competition, territoriality, waste accumulation, physiological factors • Density-Independent factors: population NOT a factor • i.e. Natural disasters: fire, flood, weather
K-selection: pop. close to carrying capacity r-selection: maximize reproductive success
1000 Human (type I) Hydra (type II) 100 Survival per thousand Oyster (type III) 10 1 0 25 50 75 100 Percent of maximum life span Life strategies & survivorship curves Which graph represents K-selection and which graph represents r-selection? K-selection r-selection
Populations fluctuate due to biotic and abiotic factors 1975-1980: peak in wolf numbers 1995: harsh winter weather (deep snow)
What do you notice about the population cycles of the showshoe hare and lynx?
Boom-and-bust cycles • Predator-prey interactions • Eg. lynx and snowshoe hare on 10-year cycle
Human Population Growth • 2 configurations for a stable human population (zero population growth): • High birth / high death • Low birth / low death • Demographic transition: occurs when population goes from A B
Global Carrying Capacity • UN predicts: 7.8 to 10.8 billion people by the year 2050 • 2012 = 7 billion • Estimated carrying capacity = 10-15 billion? • Ecological footprint: total land + water area needed for all the resources a person consumes in a pop. • 1.7 hectares (ha)/person is sustainable(hectare= 100m by 100m) • U.S.: 10 ha/person over K?? Limitations? Consequences? Solutions?
Map of ecological footprint of countries in the world (proportional sizes shown)