Download
1 / 29
290 likes | 297 Views
This chapter provides an overview of population ecology, including concepts such as population density, dispersion patterns, demography, survivorship curves, and population growth models. It also explores the factors that limit population growth and the dynamics of population fluctuations. The chapter concludes with a discussion on human population growth and the estimation of population size using the mark-recapture method.

E N D
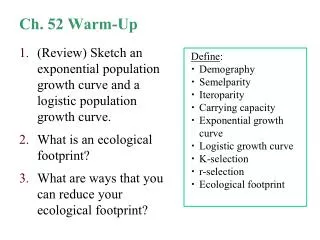
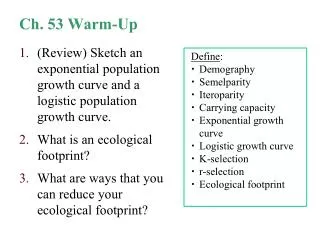
Ch. 40b Warm-Up • Define: • Demography • Semelparity • Iteroparity • Carrying capacity • Exponential growth curve • Logistic growth curve • K-selection • r-selection • Ecological footprint • (Review) Sketch an exponential population growth curve and a logistic population growth curve. • What is an ecological footprint? • What are ways that you can reduce your ecological footprint?
Chapter 40b Population Ecology
Population = group of individuals of a single species living in same general area Density: # individuals / area Dispersion: pattern of spacing between individuals Introduction
Determining population size and density: • Count every individual • Random sampling • Mark-recapture method
Patterns of Dispersal: • Clumped – most common; near required resource • Uniform – usually antagonistic interactions • Random – unpredictable spacing, not common in nature
Additions occur through birth, and subtractions occur through death. Life table: age-specific summary of the survival pattern of a population Demography: the study of vital statistics of populations and how they change over time
Survivorship Curve: represent # individuals alive at each age • Type I: low death rate early in life (humans) • Type II: constant death rate over lifespan (squirrels) • Type III: high death rate early in life (oysters)
dN/dt = B-D N = population size t = time Change in Population Size Change in population size during time interval Births during time interval - Deaths during time interval =
Exponential population growth: ideal conditions, population grows rapidly
Exponential Growth Equation dN/dt = change in population r = growth rate of pop. N = population size
Exponential Growth Problem Sample Problem: A certain population of mice is growing exponentially. The growth rate of the population (r) is 1.3 and the current population size (N) is 2,500 individuals. How many mice are added to the population each year?
Unlimited resources are rare! Logistic model: incorporates carrying capacity (K) K = maximum stable population which can be sustained by environment
Logistic Growth Equation dN/dt = change in population r = growth rate of pop. N = population size K = carrying capacity
Logistic Growth Problem Sample Problem: If a population has a carrying capacity (K) of 900, and the growth rate (r) is 1.1, what is the population growth when the population (N) is 425?
Life History: traits that affect an organism’s schedule of reproduction and survival 3 Variables: • Age of sexual maturation • How often organism reproduces • # offspring produced per reproductive episode Note: These traits are evolutionary outcomes, not conscious decisions by organisms
Semelparity • Big-bang reproduction • Many offspring produced at once • Individual often dies afterwards • Less stable environments Agave Plant
Iteroparity • Repeated reproduction • Few, but large offspring • More stable environments Lizard Critical factors: survival rate of offspring and repeated reproduction when resources are limited
K-selection: pop. close to carrying capacity r-selection: maximize reproductive success
Factors that limit population growth: • Density-Dependent factors: population matters • i.e. Predation, disease, competition, territoriality, toxic wastes, physiological factors • Density-Independent factors: population not a factor • i.e. Natural disasters: fire, flood, weather
Population Dynamics • Population fluctuations due to biotic & abiotic factors 1975-1980: peak in wolf numbers 1995: harsh winter weather (deep snow)
What do you notice about the population cycles of the showshoe hare and lynx?
Boom-and-bust cycles • Predator-prey interactions • Eg. lynx and snowshoe hare on 10-year cycle
Human Population Growth • 2 configurations for a stable human population (zero population growth): • High birth / high death • Low birth / low death • Demographic transition: occurs when population goes from A B
Sample Problem To estimate the size of an animal population, researchers often use a method known as mark-recapture, which involves marking individuals from a large population for easy identification upon recapture. The mark-recapture method assumes that the proportion of marked individuals in the recapture group is equal to the proportion of marked individuals in the entire population. Researchers used the mark-recapture method to estimate the number of individuals in a population. Using the results presented in the table below, estimate the total number of individuals in the population. Give your answer to the nearest whole number.