Download
1 / 21
210 likes | 492 Views
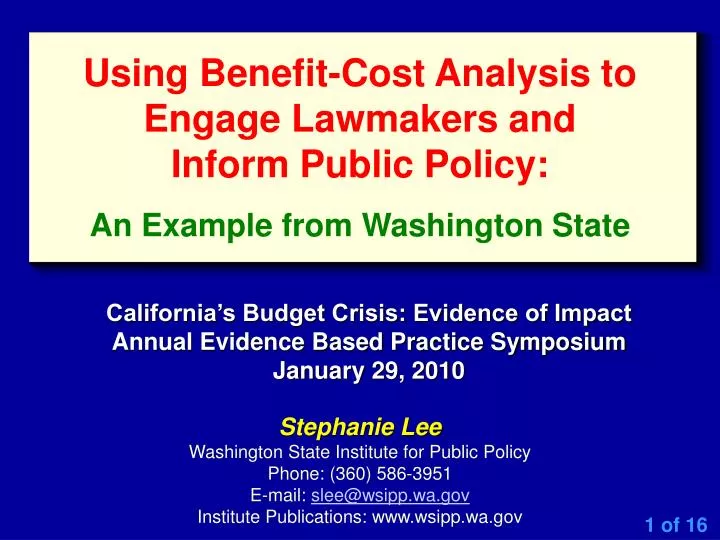
Using Benefit-Cost Analysis to Engage Lawmakers and Inform Public Policy: An Example from Washington State. California’s Budget Crisis: Evidence of Impact Annual Evidence Based Practice Symposium January 29, 2010. Stephanie Lee Washington State Institute for Public Policy

E N D
Using Benefit-Cost Analysis to Engage Lawmakers and Inform Public Policy: An Example from Washington State California’s Budget Crisis: Evidence of Impact Annual Evidence Based Practice Symposium January 29, 2010 Stephanie Lee Washington State Institute for Public Policy Phone: (360) 586-3951 E-mail: slee@wsipp.wa.gov Institute Publications: www.wsipp.wa.gov 1 of 16
WSIPP What Works Benefit-Cost Reports Policy Washington State Institute for Public Policy • Nature of the Institute • Non-partisan, 26-year history • Projects directed by legislative bills • Local, general purpose, “real-time” • Our general analytic approach • What works? What does not? Formal evidence-based reviews • Cost-benefit, return on investment • Nature of the Institute • Non-partisan, 26-year history • Projects directed by legislative bills • Local, general purpose, “real-time” • Our general analytic approach • What works? What does not? Formal evidence-based reviews • Cost-benefit, return on investment Created by the 1983 Legislature • Board of Directors • Senator Karen Fraser (D) • Senator Jeanne Kohl-Welles (D) • Senator Pam Roach (R) • Senator Mark Schoesler (R) • Representative Glenn Anderson (R) • Representative Mary Lou Dickerson (D) • Representative Phyllis Kenney (D) • Representative Skip Priest (R) • Ken Conte, Non-Partisan House Staff • Richard Rodger, Non-Partisan Senate Staff • Robin Arnold-Williams, Gov. Policy Dir. • Victor Moore, State Budget Director • Sandra Archibald, Univ. of WA • James Gaudino, Central WA Univ. • Les Purce, The Evergreen State Col. • Robert Rosenman, WA State Univ. WSIPP Capitol My House Seattle Olympia 2 of 16
WSIPP What Works Benefit-Cost Reports Policy Common Legislative Questions • What works? . . . the “evidence-based” question • Crime • Child Welfare • Education • Mental Health / Substance Abuse • What’s economic? • How much does it cost? • What are the long-term benefits in monetary/fiscal terms? 3 of 16
WSIPP What Works Benefit-Cost Reports Policy Why are These Questions Important? • Finding out “what works” can result in better outcomes for people. • Improving outcomes in a economically sound way is politically attractive. • Implementing cost efficient programs can help balance a budget: • Long-term criminal justice/victimization costs • Long-term child welfare system/victim costs • Long-term benefits of education 4 of 16
WSIPP What Works Benefit-Cost Reports Policy How Do We Determine What Works? • Standards of evidence: • Rigorous design and methods • Random assignment experiments • “Natural” experiments • Statistically well-controlled comparisons • Real-world evaluation 2. She applies “standards of evidence” to identify the high quality studies 3. She analyzes all of the higher quality studies to estimate an average effect 1. WSIPP researcher gathers all the studies she or he can locate on a topic 5 of 16
WSIPP What Works Benefit-Cost Reports Policy How Effective is a Program or Policy? • Need to know more than “does it work?” • Meta-analysis • Allows us to combine findings across research studies • Politically neutral technique • Calculating an effect size • Tells us how much of a standard deviation change we might expect • Discount factors • Permit us to provide a cautious estimate, based on relative research quality 6 of 16
WSIPP What Works Benefit-Cost Reports Policy An Example from Child Welfare: Selected Programs Program Child Abuse Out - of - Home Permanent Stable & Neglect Placement Placement Placement Chicago Child Parent Centers: - .34 - .34 Not measured Not measured Nurse Family Partnership for Low - - .44 Not measured Not measured Not measured Income Families: Other Home Visiting Programs (for - .19 No effect Not measured Not measured At - Risk Mothers): No effect Parents as Teachers: Not measured Not measured Not measured Dependency (Family Treatment) .14 - .15 .14 Not measured Drug Court: Homebuilders Family Preservation - .14 - .35 Not measured Not measured Services: Other Family Preservation Services: No effect .10 Not measured Not measured Parent - Child Interaction Therapy: - .42 Not measured Not measured Not measured Family Assessment Response (MN): No effect - .08 Not measured Not measured Subsidized Guardianship (Illinois): .16 No effect Not measured Not measured 7 of 16
WSIPP What Works Benefit-Cost Reports Policy Long-Term Economics • ES • Program abuse & neglect • Crime • HS Graduation • Substance Abuse • K-12 Grade repetition • How large is the impact of the program on each measured outcome (effect size)? • Does the measured outcome have a causal link to another, unmeasured outcome? • What are the long-term effects of those outcomes on: • The participant • Increased education • Reduced abuse/neglect • The taxpayer • Avoided incarceration costs • Avoided child welfare system costs • Other people in society • Reduced victimization ES ES ES ES 8 of 16
Does Nurse Family Partnership Affect These Outcomes? Statistically significant impacts Decrease Crime Rates Later in the Youth’s Life High School Graduation Increase Decrease Disordered Drug Use Increase Standardized Test Scores (end of HS) Decrease Disordered Alcohol Use What does this mean? Answer: Without participation in Nurse Family Partnership, a “high risk” youth has a 23.9% chance of being abused or neglected in his or her lifetime; with NFP, the odds decrease to about 13.2%. Decrease Child Abuse & Neglect in the Youth’s Family WSIPP What Works Benefit-Cost Reports Policy An Example from Child Welfare Decrease K-12 Grade Repetition 9 of 16
Reduced child abuse and neglect $3,873 Lower CW / victim costs Increased test scores $9,454 Increased earnings Reduced crime $13,410 Lower CJ / victim costs Increased high school graduation $1,141 Increased earnings Reduced K-12 grade repetition $11 Lower K-12 Costs Reduced alcohol and drug abuse $237 Increased earnings $3.02 WSIPP What Works Benefit-Cost Reports Policy Economic Bottom Line: Nurse Family Partnership Benefits Per Youth Main Source of Benefits $26,986 Total Benefits Per Youth $8,931 Cost Per Youth Benefits Per Dollar of Cost 10 of 16
WSIPP What Works Benefit-Cost Reports Policy Reporting Benefit-Cost Analysis Results: An Example from Child Welfare 11 of 16
WSIPP What Works Benefit-Cost Reports Policy Reporting Benefit-Cost Analysis Results: Our “Consumer Reports” Lists • What Works? • What Doesn’t? • What Are the Benefits & Costs? • What Don’t We Know? Reports available for downloading www.wsipp.wa.gov 12 of 16
WSIPP What Works Benefit-Cost Reports Policy Institute Publications: www.wsipp.wa.gov • Reports Are Available on: • Child Welfare • Prevention • Criminal Justice • Juvenile Justice • Education • Mental Health • Substance Abuse • …More on the way 13 of 16
WSIPP What Works Benefit-Cost Reports Policy Common Findings • Many programs have been well-evaluated. • Some programs work, others do not • Still others have inconclusive results • Many programs have not been well-evaluated! • For effective programs, some make good economic sense, and others do not. • Benefit-cost analysis is not the best approach for all topics. 14 of 16
WSIPP What Works Benefit-Cost Reports Policy How Benefit-Cost Analysis Can Influence Policy • Provides policymakers with a longer-term view of spending and its consequences: • Good, • Bad, or • Ugly? • Provides agencies with options of effective and cost-effective programs to implement, e.g., • Intensive family preservation services • High-quality early childhood education 15 of 16
WSIPP What Works Benefit-Cost Reports Policy How Benefit-Cost Analysis has Influenced Policy in Washington State • New language on “evidence-based” strategies in legislation • Changed forecasts of service populations • Allowed Washington to remove one forecasted prison that was slated for construction. 16 of 16
Prison Beds 30,000 Dec 2006 Prison Bed Forecast 28,000 Current Level Portfolio “Moderate” Expansion Portfolio 26,000 “Aggressive” Expansion Portfolio 24,000 3 2 prison shortfall 22,000 20,000 18,000 16,000 0 0 2008 2008 2010 2010 2012 2012 2014 2014 2016 2016 2018 2018 2020 2020 2022 2022 2024 2024 2026 2026 2028 2028 2030 2030 Prison Supply & Demand in Washington: 2008 to 2030 WSIPP What Works Benefit-Cost Reports Policy 30,000 CFC prison forecast and WSIPP extension 28,000 Forecast with Current Level Portfolio Forecast with Moderate Implementation Portfolio Forecast with Aggressive Implementation Portfolio 26,000 24,000 22,000 20,000 18,000 Existing Prison Supply Existing Prison Supply & Rented Jail Beds & Rented Jail Beds 16,000
WSIPP What Works Benefit-Cost Reports Policy How Benefit-Cost Analysis has Influenced Policy in Washington State • New language on “evidence-based” strategies in legislation • Changed forecasts of service populations • Allowed Washington to remove one forecasted prison that was slated for construction. • What’s next? 16 of 16
NFP CAN High School Graduation Child Abuse and Neglect (CAN) Outcomes Example: Nurse Family Partnership (NFP) Monetization of NFP’s CAN outcome on High School Graduation Step 1: The Effect of the NFP Program on CAN outcome -.883 NFP Unadjusted Effect Size on CAN (Olds et al., 1997, p value =.000) -.441 NFP Adjusted Effect Size (Adjusted by WSIPP) on CAN .126 Base CAN Rate Without NFP .061 Change in CAN rate given the program effect [via dcox transformation] Step 2: The Effect of CAN on High School Graduation -.215 CAN Adjusted Effect Size (by WSIPP) on High School Graduation .700 Base High School Graduation Rate -.0793 Change in High School Grad Rate given CAN [via dcox transformation] Step 3: The Value of High School Graduation $235,875Expected Value of HS Graduation, Present Valued to age 0 Step 4: Expected Value of NFP on HSchool Grad, via Effect of NFP on CAN $1,141 Value of NFP on CAN from High School Grad [.061 X .0793 X $177,806] Appendix
Overview Child Welfare What Works Cost-Benefit Portfolio The Consequences of Child Abuse & Neglect 1. Direct CPS & Child Welfare Costs 2. Victim Medical, Mental Health and Quality of Life Costs 3. Other Long-Term Outcomes Causally Linked to CAN • Child Protective Services • CPS investigations • Alternative response cases • Police involvement • Juvenile court dependency cases • Child Welfare Services • Foster care • Adoption support • Juvenile court termination cases • Medical costs • Mental health costs • Quality of life costs (e.g., lost wages) • Crime • High school graduation • Standardized test scores • K-12 grade repetition • Teenage pregnancy/ births • Disordered alcohol use • Disordered drug use