Download

1 / 42
420 likes | 508 Views
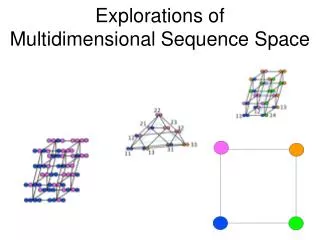
Developing and Using a Multidimensional Space for Reporting Test Results. Mark D. Reckase Michigan State University. Basic Concepts. People are complicated. To accurately describe people, we need to locate them in a space of fairly high dimensionality. Test items are complicated.

E N D
Developing and Usinga Multidimensional Space for Reporting Test Results Mark D. Reckase Michigan State University
Basic Concepts • People are complicated. • To accurately describe people, we need to locate them in a space of fairly high dimensionality. • Test items are complicated. • The data sets that result from persons taking tests (test items) are the result of interactions of the dimensions of variability of people and the dimensions of skills and knowledge needed to answer the test items.
Dimensions versus Constructs • For this presentation, the term “dimension” is used to indicate a coordinate axis in a coordinate system that are used to locate people. • Constructs are the targets of educational or psychological measurement. • Constructs and dimensions may not be the same thing – that is, the orientation of differences among people may not align with a coordinate axis.
Setting Up a Coordinate System • If we acknowledge that people are complicated and we want to know how they change from the educational process, we need to set up a coordinate system that supports that. • The first step in setting up a coordinate system is determine the number of axes needed to locate objects. • After that, the orientation of the coordinate system and the units along the system can be specified.
The Number of Dimensions Problem • The number of dimensions is the number of coordinates for locating each person that will allow the recovery of the relationships in the data. • The number is dependent on how accurately you want to reproduce the relationships. • Parallel analysis has been found to give reasonable estimates of number of dimensions.
Parallel Analysis • Determine the distribution of each of the variables of interest – usually test items. • Randomly generate a data matrix of the same size that has the same distribution for each variable. • For dichotomous items, the data are generated with a binomial model to have the same proportion correct as the real item data. • Generate multiple random samples to yield sampling distribution under the null hypothesis of random data.
Parallel Analysis • Compute measures of correlation between the variables and then the scree plot for the real data. • Compute the scree plots for each randomly generated sample and determine the 95% confidence envelope around plot lines. • Determine the number of eigenvalues significantly above the random scree plot line.
Examples • Data • Simulation based on three clusters of items in three dimensional space. • 50 items • Divided into sets of 10, 20, 20 • This is simple structure, but not orthogonal simple structure. • Real data from a 6th Grade Mathematics Test. • 28 items • Five content areas
Picking the Coordinate System • Once the number of dimensions (coordinate axis) is determined, the next step is to pick the orientation of the axes. • This is a totally arbitrary decision. • Usually, for achievement and aptitude measures, we choose to orient the axes so that more achievement or aptitude is to the right or up.
The Orientation of Axes • The goal is to create a coordinate system that can be used to map the locations of persons, and changes in locations of persons. • The person who draws the map gets to choose the coordinate system. • We often let this important task go by default to a computer programmer who wrote the analysis program. • Don’t give up your power to be the map-maker.
The Metric of the Space • By metric of the space is meant the relative distances and orientation of a set of points. • The metric of the space does not exist until a model is specified for the data. • For so called “non-metric” multidimensional scaling, the metric is set by the selection of the similarity or difference measure between objects of study.
The Metric of the Space • For this presentation, the metric of the space is set by the use of a multidimensional item response theory model. • This model includes a parameter, θ, that is a vector of size m with the coordinates of the location of a person. • m is the number of dimensions needed to represent the data.
The Metric of the Space • The model used to set the metric is the multidimensional extension of the two-parameter logistic model. • a is a vector of discrimination parameters • d is an intercept parameter related to the difficulty of the item.
The MIRT Model • This model has a fixed mathematical form. • The variations in the mathematical form are controlled by the item parameters, a and d. • The figures on the following slide show the form of the function for two dimensions, a = [.5 1], and d = -.7. • The graphic shows the predicted probability of response to a dichotomous item for persons located at different places in the space.
Some Useful Item Descriptions • The graphic shows the idealized characteristics of one test item. • The item parameters contain the information about the test item. • The exponent of the model is an equation of a line in space. The location of the line changes with the probability. • All persons on the same line have the same probability of correct response.
Some Useful Item Descriptions • Showing each item as a graphic is difficult for a test with many items. A more compact representation is needed. • Determine the direction of steepest slope. • Determine the line with the steepest slope. • Represent a test item as an arrow pointing up slope with the base resting on the line of steepest slope and length related to the slope.
Specifying the Coordinate Axes • The MIRT analysis programs have default procedures for setting the coordinate axes. • One way is to assume a multivariate normal distribution for the coordinates of person locations with a mean vector of 0 and an identity matrix for the variance/covariance matrix. • Another way is to assume simple structure for the items and mean difficulty of zero.
Specifying the Coordinate Axes • The defaults are fine if we don’t have any other information. • But, if we are tracking the changes in students, the defaults may be misleading. • Is it reasonable to assume variances of all coordinates are the same? • Is it reasonable to assume that the means are all the same? • If we are only interested in correlations, these assumptions are okay, but not otherwise.
Revisiting the Box Problem • Measured the width, height, and depth, of 20 cardboard boxes. • Mean width 14.75 SD 3.83 • Mean height 9.125 SD 4.71 • Mean depth 10.89 SD 3.64 • Correlations rwh .45, rwd .35, rhd .10 • All measurements are at right angles
Revisiting the Box Problem • If the raw measures are used as coordinates, are the axes orthogonal? • If the box with the most similar coordinates (a box shaped like a cube) is identified using raw measures (14.25 14.5 14.5), will the same box be identified using coordinates standardized to mean 0, standard deviation 1 (6.75 1.75 3.75)? • The default coordinate system from a computer program does not necessarily mirror reality.
Specifying the Coordinate System • Decide on the meaningful orientation of the coordinate axes. • Decide on a useful origin for the space. • Decide on units for each axis. These do not have to be equal in terms of standard deviation units. • The designers of the street system for Manhattan Island accepted this advice.
The Coordinate System from a Hypothetical Test • A test of English as a foreign language • Reading 30 items • Vocabulary 20 items • Conversation 30 items • These components of the test are the constructs and under the default analysis, they do not align with the coordinate axes. • The parallel analysis indicates only two coordinate axes are required. For the default coordinates • Means and sd’s near 0 and 1 • Correlations near 0.
Comments • It is not likely that language skills are uncorrelated. • It would be useful for score reporting if some constructs corresponded to the coordinate axes. • There is no reason to believe that the standard deviation of these constructs are the same.
Rotation • To determine the transformation that aligns the sets of items with the axes, • Determine the reference composite for each set. This is the eigenvector associated with the largest eigenvalue of the a’a matrix for each set of items. • Use non-orthogonal Procrustes to determine the rotation of the reading and speaking constructs to align with the axes. • When the rotation is applied to the a-parameters, the inverse transformation must be applied to the θs to maintain invariance.
Translation and Scaling • The default transformation sets the means of the coordinates to zero. But the developers want 0 to be set at the performance standards. These are at -.5 for reading and .7 for conversation. • The reading items are more accurate, so the scale units are made smaller. A fixed distance will have more units. • Conversation items are less accurate so that scale should have larger units. A fixed distance has fewer units.
Results of Transformation • Now, coordinates give scores on reading and conversation relative to standards. • Means and standard deviations of coordinates change • Reading .61 1.21 • Conversation -.44 .60 • Correlations between coordinates also change -- .56. Originally, the coordinates where not the same as the constructs.
Vocabulary Score • This score can be estimated through either rigid rotation to the first axis, • Or, by projecting locations onto the reference composite.
Equating • Once the base space is set, later test forms can be transformed to the same coordinate system. • Common item design with items on all constructs. • Common person design with same persons taking two forms. • Randomly equivalent groups design rotating to match reference composites for tests.
Conclusions • The basic idea is to create a multidimensional map coordinate system for indicating the locations of people. • That coordinate system should be thoughtfully developed rather than accepting the defaults from computer programs. • Once the coordinate system is developed, future test results should be transformed to that system. • This will allow students’ travels through the universe of knowledge and skills to be monitored.