Download
1 / 1
10 likes | 76 Views
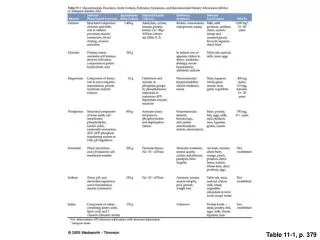
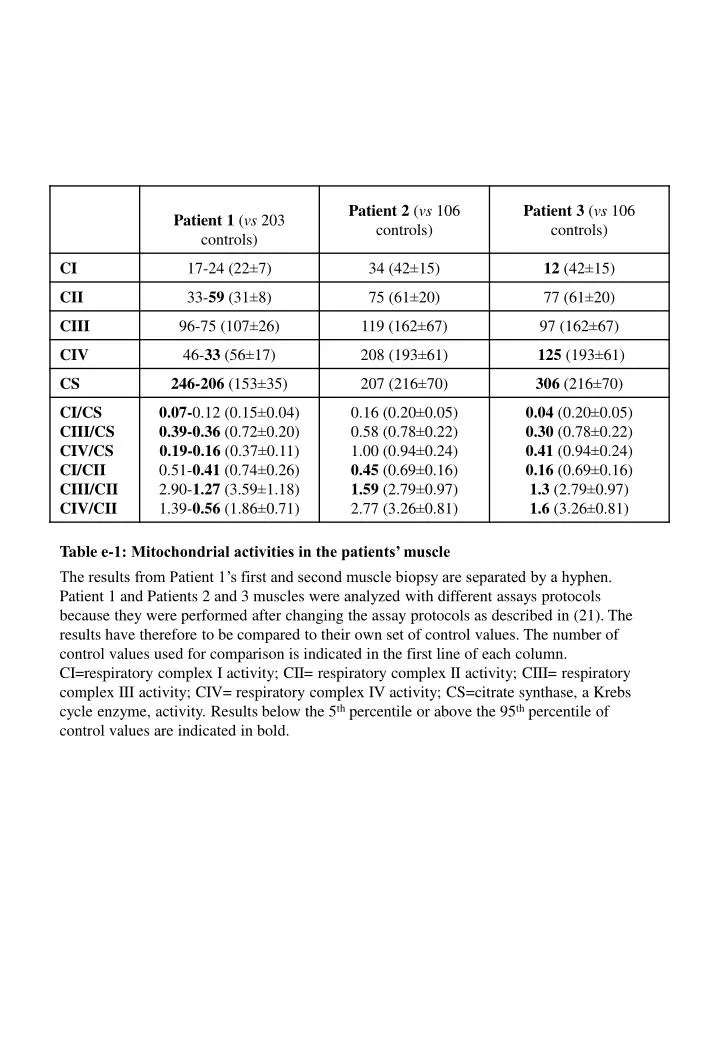
Table e-1: Mitochondrial activities in the patients’ muscle.

E N D
Table e-1: Mitochondrial activities in the patients’ muscle The results from Patient 1’s first and second muscle biopsy are separated by a hyphen. Patient 1 and Patients 2 and 3 muscles were analyzed with different assays protocols because they were performed after changing the assay protocols as described in (21). The results have therefore to be compared to their own set of control values. The number of control values used for comparison is indicated in the first line of each column. CI=respiratory complex I activity; CII= respiratory complex II activity; CIII= respiratory complex III activity; CIV= respiratory complex IV activity; CS=citrate synthase, a Krebs cycle enzyme, activity. Results below the 5th percentile or above the 95th percentile of control values are indicated in bold.