1 / 1

Disbursements for HIV per US$ 1 Million GDP, 2006

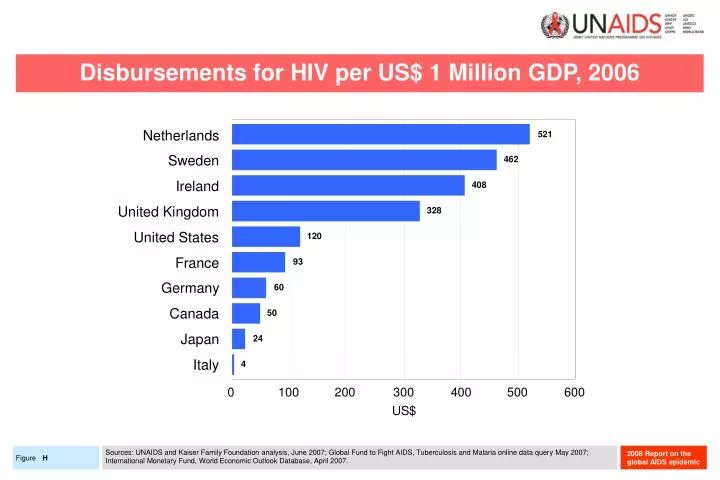
Netherlands. 521. Sweden. 462. Ireland. 408. United Kingdom. 328. United States. 120. France. 93. Germany. 60. Canada. 50. Japan. 24. Italy. 4. 0. 100. 200. 300. 400. 500. 600. US$. Disbursements for HIV per US$ 1 Million GDP, 2006.

Download Presentation

Disbursements for HIV per US$ 1 Million GDP, 2006

An Image/Link below is provided (as is) to download presentation Download Policy: Content on the Website is provided to you AS IS for your information and personal use and may not be sold / licensed / shared on other websites without getting consent from its author. Content is provided to you AS IS for your information and personal use only. Download presentation by click this link. While downloading, if for some reason you are not able to download a presentation, the publisher may have deleted the file from their server. During download, if you can't get a presentation, the file might be deleted by the publisher.

E N D

Presentation Transcript


  1. Netherlands 521 Sweden 462 Ireland 408 United Kingdom 328 United States 120 France 93 Germany 60 Canada 50 Japan 24 Italy 4 0 100 200 300 400 500 600 US$ Disbursements for HIV per US$ 1 Million GDP, 2006 Sources: UNAIDS and Kaiser Family Foundation analysis, June 2007; Global Fund to Fight AIDS, Tuberculosis and Malaria online data query May 2007; International Monetary Fund, World Economic Outlook Database, April 2007. H

More Related