Download
1 / 23
230 likes | 235 Views
Figure 2.1: The importance of growth in GDP per worker for the level of GDP per worker. Figure 2.1: The importance of growth in GDP per worker for the level of GDP per worker (cont.). Figure 2.1: The importance of growth in GDP per worker for the level of GDP per worker (cont.).

E N D
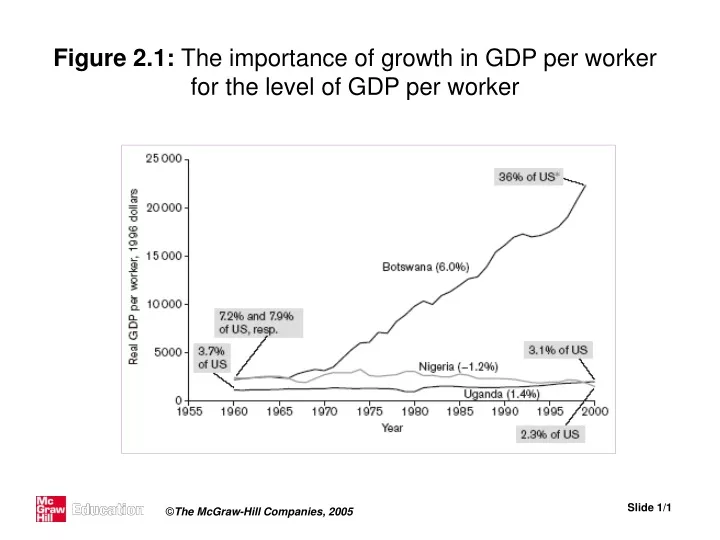
Figure 2.1: The importance of growth in GDP per worker for the level of GDP per worker
Figure 2.1: The importance of growth in GDP per worker for the level of GDP per worker (cont.)
Figure 2.1: The importance of growth in GDP per worker for the level of GDP per worker (cont.) Source: Penn World Table 6.1
Table 2.1: GDP per capita and per worker (2000) Source: Penn World Table 6.1
Figure 2.2: Lorenz curves for the world, 1960 and 1998, 104 countries Source: Penn World Table 6.1
Table 2.2: The world’s prosperity ‘Top 15’ and ‘Bottom 15’, 1960 and 1998
Table 2.2: The world’s prosperity ‘Top 15’ and ‘Bottom 15’, 1960 and 1998 (cont.) Source: Penn World Table 6.1
Table 2.3: World growth ‘bottom 20’ and ‘top 20’, 1960–1998 (cont.)
Figure 2.3: Convergence of GDP per worker among selected countries, 1950–2000 Source: Penn World Table 6.1
Figure 2.4: Average annual growth rate of GDP per worker against initial level of GDP per worker, 24 OECD countries Source: Penn World Table 6.1
Figure 2.5: Average annual growth rate of GDP per worker against initial level of GDP per worker,90 countries Source: Penn World Table 6.1
Figure 2.6: Average annual growth rate of GDP per worker adjusted for structural characteristics against the initial level of GDP per worker, 90 countries Source: Penn World Table 6.1
Figure 2.8: GDP per capita, Western countries (cont.) Source: Angus Maddison, Monitoring the World Economy 1820–1992, OECD, 1995.
Figure 2.9: Labour’s share of domestic factor incomes (cont.)
Figure 2.9: Labour’s share of domestic factor incomes (cont.) Source: USA: Bureau of Economic Analysis. Denmark: ADAM database, Statistics Denmark. Remaining countries: OECD National Accounts.
Figure 2.10: Real interest rates, Western countries (cont.) Source: Interest rates from S. Homer and R. Sylla, A History of Interest Rates, Rutgers University Press, 1991. Consumer price indices from B.R. Mitchell, International Historical Statistics, 1750–1993, Macmillan, 1998.