Download
1 / 8

E N D
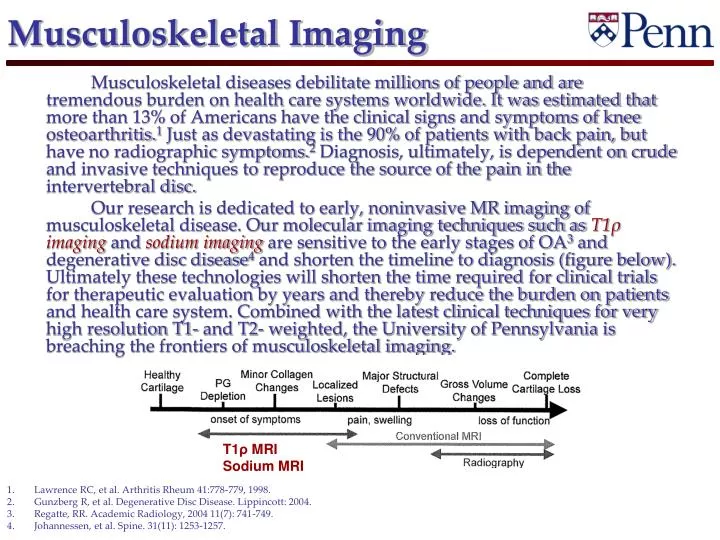
Musculoskeletal Imaging Musculoskeletal diseases debilitate millions of people and are tremendous burden on health care systems worldwide. It was estimated that more than 13% of Americans have the clinical signs and symptoms of knee osteoarthritis.1 Just as devastating is the 90% of patients with back pain, but have no radiographic symptoms.2 Diagnosis, ultimately, is dependent on crude and invasive techniques to reproduce the source of the pain in the intervertebral disc. Our research is dedicated to early, noninvasive MR imaging of musculoskeletal disease. Our molecular imaging techniques such asT1ρ imaging and sodium imagingare sensitive to the early stages of OA3 and degenerative disc disease4 and shorten the timeline to diagnosis (figure below). Ultimately these technologies will shorten the time required for clinical trials for therapeutic evaluation by years and thereby reduce the burden on patients and health care system. Combined with the latest clinical techniques for very high resolution T1- and T2- weighted, the University of Pennsylvania is breaching the frontiers of musculoskeletal imaging. T1ρ MRI Sodium MRI • Lawrence RC, et al. Arthritis Rheum 41:778-779, 1998. • Gunzberg R, et al. Degenerative Disc Disease. Lippincott: 2004. • Regatte, RR. Academic Radiology, 2004 11(7): 741-749. • Johannessen, et al. Spine. 31(11): 1253-1257.
3D isotropic T1-weighted 0.5 mm3 isotropic TA = 7:30 min
3D isotropic T1-weighted 0.5 mm3 isotropic TA = 7:30 min Figure 2: T1-weighted images are ideal for visualizing joint space narrowing and cartilage thinning and make an ideal substitute for traditional CT diagnosis. This isotropic T1-weighted set was obtained using a magnetization prepared rapid gradient echo sequence (mp-RAGE). The sequence shows superior visualization of cartilage anatomy to conventional spoiled gradient echo imaging. We use a full 3D isotropic mp-RAGE for cartilage segmentation.
2D multislice T2-weighted Figure 3: High resolution T2-weighted images can be obtained with in-plane resolutions less than 300 μm2 and 2 mm slice thickness. This T2-weighted image is one of 25, contiguous slices through the knee joint.
Rapid 3D molecular imaging (< 10 minutes) T1ρ (ms) Figure 4: T1ρ molecular maps display the distribution of matrix molecules ( proteoglycan concentration in the cartilage). Recent advances in T1ρ imaging technology now acquire 32 slice T1ρ relaxation maps in less than 10 minutes. Here we demonstrate the new sequence on two human subjects, one healthy and one early symptomatic subject. The top figure shows a coronal T1ρ map of a healthy subject, which shows the T1ρ distribution in healthy cartilage. The bottom figure is an axial T1ρ map of a symptomatic subject demonstrating elevated T1ρ across the cartilage. 0.7 x 0.7 x 3 mm3 32 Slices per view TA = 10 min
T1ρ imaging of chondromalacia Figure 5: Preliminary results from an osteoarthritic subject diagnosed (arthroscopically) with grade I chondromalacia in the lateral facet of the patella. The left hand side figure shows the 3D T1ρ relaxation map of the patellar cartilage. The color scale shows a volume rendered representation of T1ρ relaxation times. The image on the right shows a slice of the T1ρ map at the position indicated by a line on the T1ρ surface (on the left) overlayed on the patellar cartilage of a PD-weighted image. The dashed elliptical region on the image on the left is the arthroscopically confirmed region of chondromalacia.
Sodium imaging of osteoarthritis Detection of molecular loss in cartilage. Figure 6: In vivo sodium images of human subjects: (A) An axial secion of a sodium image on a healthy volunteer. Notice the uniform distribution of high sodium intensity across the cartilage. (B) An axial sodium image from a symptomatic OA subject demonstrating heterogeneous distribution of low sodium intensity across the cartilage.
Magic echo imaging of DDD Figure 7: Magic echo imaging of the disc reveals features enhances sensitivity to the nucleus pulposus over conventional T2-weighted imaging. It is possible to quantify changes in the nucleus pulposus during DDD with this technique.