Download
1 / 51
510 likes | 632 Views
Dynamic Pedestrian and Vehicular Modelling. J. MacGregor Smith & M. Blakey Smith Department of Mechanical and Industrial Engineering & Facilities Planning University of Massachusetts Amherst MA 01003 http://www.ecs.umass.edu/mie/faculty/smith/. Overview. Methodology Representation

E N D
Dynamic Pedestrian and Vehicular Modelling • J. MacGregor Smith & M. Blakey Smith • Department of Mechanical and Industrial Engineering & Facilities Planning • University of Massachusetts • Amherst MA 01003 http://www.ecs.umass.edu/mie/faculty/smith/
Overview • Methodology • Representation • Analysis • Synthesis • Case Studies • Newton-Wellesley Hospital Campus • Engineered Polymers Warehouse Facility • Automated Teller and Walkup Facility
Representation Step 1.0: Define Customer Classes Step 2.0: Define Routing vectors Step 3.0: Define Distance and Flow Matrices Analysis Step 4.0: Topological Diagrams Step 5.0: Layout Alternatives Step 6.0: Flow Analysis Synthesis Step 7.0: Evaluation of Alternatives Step 8.0: Synthesis Step 9.0: Implementation Basic Methodology
Representation • Step 1.0: What customers (patients, staff, visitors) are moving through the facility? • Step 2.0: Define the route sheets for the customer classes • Step 3.0: From-To Charts, Distance and Flow Matrices: P(i,j); D(i,j)
Analysis • Step 4.0: Generate the topological diagram relating the route sheets and the physical facility. • Step 5.0: Generate the alternative layouts • STEP/MAFLAD • Step 6.0: Generate the analytical and simulation models for analysis • QNET/ARENA
Synthesis • Step 7.0: Evaluation of Alternatives • Step 8.0: Synthesis of Results (sensitivity analysis) • Step 9.0: Implementation of Plans
Design Issues • What are the fundamental design and performance variablesinvolved in designing a circulation system? • How are these fundamental design (d), performance (p), and contextual (c) variables related? P=f(c,d)
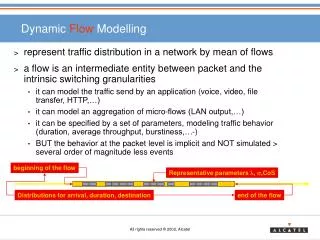
What is Congestion? • Congestion occurs mainly as a result of increased number of pedestrians and vehicles competing for the limited space of a corridor or roadway segment.
Empirical Model • The service rate (speed) decays within a corridor • Since there is a finite amount of available space within each corridor, the density of pedestrians reaches an upper limit (jam density).
Performance Measures • Flow (q) Output volume or throughput • Density (k)the number of customers or vehicles travelling over a unit length • Pedestrian Speed () • Time (t)
Design Variables • Length (L) of the corridor or highway segment • Width (W) of corridor or highway segment. • Capacity (C) = 5 LW • Other variables of interest e.g. • pavement materials, patterns, etc. • grades, stairs, etc. • geometric curves, etc.
Contextual Variables • Input Volume ():= total number of pedestrians that enter a circulation segment during a given time interval • Other contextual variables • obstacles, • weather conditions • climate • wind conditions
Building Blocks Methodology Public Buildings • Airports • Courthouses • Hospitals • Malls • Campuses • Freeways
LinearModel • A:= average pedestrian or vehicle speed • C: capacity of the corridor or highway segment C = f(L,N)
ExponentialModel • := scale parameter • := shape parameter
Empirical Curves of Pedestrian Stairwell Flows (after Fruin)
Representation of Facilities • Floor Plan/Section Graph Representation
Engineered Polymers Inc. • Warehouse capacity analysis • Dynamic material handling design • Layout and equipment needs • Forecast space utilization over time • Bottleneck analysis • Over to Simulation model animations …
Warehouse Capacities • Raw materials Semi-Finished
Holyoke Power and Light • Pedestrian vehicular layout alternatives • Horseshoe Counter with 1 ATM • Horseshoe Counter with 2 ATMs • Linear Counter • L-Shaped Counter • Animations of different alternatives • Summary of results
Basic Data • Cashiers • 128 drive-ups /day, Ave Time: 1 min 9 sec • 290 walk-ins /day, Ave Time: 1 min 18 sec • Credit • 12 walk-ins /day, Ave Time: 6.42 min • 27 call-ins / day, Ave Time: 3.78 min • Customer Accounts • 36 walk-ins /day, Ave Time: 4.30 min • 37 call-ins /day, Ave Time: 2.54 min • Water Dept: 5% of 8100 customers /month
Assumptions • 70% customers enter via parking lot, 30% enter via Suffolk Street • If cashiers are backed up, computer entries are postponed until they are free • Cashiers operate on the policy of First-Come-First-Served when serving both walk-ins and drive-ups • With Water Dept, an additional cashier is available, and all cashiers handle all types of customers
Simulation Experiments • Results analyzed over 30 independent days of operation • Simulation programs written in SIMAN and animations developed in ARENA • Animations shown for each alternative over 1 day (8 hours) of operation • Over to animations .....
Representation Step 1.0: Define Customer Classes Step 2.0: Define Routing vectors Step 3.0: Define Distance and Flow Matrices Analysis Step 4.0: Topological Diagrams Step 5.0: Layout Alternatives Step 6.0: Flow Analysis Synthesis Step 7.0: Evaluation of Alternatives Step 8.0: Synthesis Step 9.0: Implementation Methodology Summary