Download
1 / 60
610 likes | 735 Views
Using Data to Improve Student Achievement. Sponsored by:. View all upcoming webinars @ www.edweek.org/go/webina r. Gerald Herbert/AP. Katie Ash

E N D
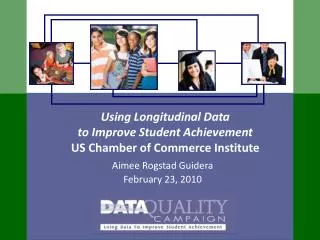
Using Data to ImproveStudent Achievement Sponsored by: View all upcoming webinars @ www.edweek.org/go/webinar Gerald Herbert/AP
Katie Ash Staff writer for Education Week and Education Week Digital Directions. Blogger at Digital Educationwww.edweek.org/go/digedOn Twitter at www.twitter.com/digidirections Our Education Week Guest
Martha Greenway Director, EdTech Leaders Online, Education Development Center Our Guests: Baron Rodriguez Director of state data systems, Data Quality Campaign
Follow today’s conversation on Twitter. Go to Twitter, and search using keyword #edweeklive. Use the hashtag to converse, share resources, tips, and URLs with our live audience.
Ensuring Effective Data Use to Improve Student Achievement Baron Rodriguez, Director State Data Systems December 2009
Federal (ARRA) Funding Effect • Every governor and chief state school officer has committed to building a P–20/workforce longitudinal data system with all 10 Essential Elements by 2011. • Policy issues previously considered “untouchable” are now being discussed. States are addressing obstacles, including legal barriers, to linking and/or using teacher and student information.
10 Essential Elements 1. Unique statewide student identifier 2. Student-level enrollment, demographic and program participation information 3. Ability to match individual students’ test records from year to year to measure growth 4. Information on untested students 5. Teacher identifier system with ability to match teachers to students 6. Student-level transcript information, including information on courses completed and grades earned 7. Student-level college readiness test scores 8. Student-level graduation and dropout data 9. Ability to match student records between the P-12 and postsecondary systems 10. State data audit system assessing data quality, validity, and reliability
Coming in January 2010: Survey results for the DQC 10 State Actions
State District Work The Data Quality Campaign partnered with APQC Education to conduct a benchmarking study on: • Data Collection & Reporting • Collecting and aggregating data from (often disparate) data sources • Ensuring data reliability and validity • State-district data transfer • Data Management and Analysis • Best practices in data management/maintenance • Best practices in data analysis • Culture • Integrating data into daily activities • Organizational structures, policies, practices that promote data use • Utilization • Promoting use of data at all levels • Professional Development/Training
Aldine ISD, TX* Anoka-Hennepin School District, MN* Baltimore County Public Schools, MD Bedford County Department of Education, TN* Bellevue School District 405, WA Blue Valley School District, KS* Carrollton-Farmers Branch ISD, TX Charles County Public Schools, MD Chicago Public Schools, IL* Clark County School District, NV* Community Consolidated School District 93, IL* Community Unit School District #300, IL* Corpus Christi ISD, TX* Coventry Public Schools, RI* Cypress Fairbanks ISD, TX* Dallas ISD, TX* Dysart Unified District, AZ* East Baton Rouge Parish School Board, LA* Elk Grove Unified School District, CA* Enlarged City School District of Middletown, NY* Fairfax County Public Schools, VA* 71 Participating Districts North Penn School District, PA* Oakland USD, CA* Palo Alto Unified School District, CA* Paradise Valley Unified District, AZ* Pasco County School District, FL* Pawtucket School Department, RI Pinellas County Public Schools, FL* Poudre School District, CO* Prince William County Public Schools, VA* Richland County School District 2, SC Rockwood School District, MO* Sacramento City Unified School District, CA* San Diego Unified School District, CA San Francisco Unified School District, CA St. Charles CUSD 303, IL* St. Charles Parish Public Schools, LA* Tulsa Public Schools, OK* Virginia Beach City Public Schools, VA* Wake County Public School System, NC* Washoe County School District, NV* Waukesha School District, WI* Western Heights Public Schools, OK* Westfield Washington Schools, IN* Fort Wayne Community Schools, IN* Fort Worth ISD, TX* Fresno Unified School District, CA Fulton County Schools, GA* Gaston County Schools, NC* Guilford County Schools, NC* Gwinnett County Public Schools, GA* Hampton City Public Schools, VA* Harford County Public Schools, MD* Houston ISD, TX* Humble ISD, TX Iredell-Statesville Schools, NC* Jenks Public Schools, OK* KIPP: Houston, TX Klein ISD, TX* Lake Washington School District No. 414, WA Los Angeles Unified School District, CA* Loudoun County Public Schools, VA* Mesa Unified School District, AZ* Metropolitan Nashville Public Schools, TN* Miami-Dade County Public Schools, FL* Montgomery County Public Schools, MD* New York City Public Schools, NY*
Best-Practice Partners • Aldine ISD, TX • Fulton County Public Schools, GA • Gwinnett County Public Schools, GA • Western Heights, OK • Iredell-Statesville Schools, NC • Montgomery County Public Schools, MD • Palatine (CC School District 15), IL • Clark County Public Schools, NV
Key Characteristics of Best Practice Districts • Utilize Standards-Based Measures to Inform Instructional Decisions • Offer professional development opportunities to support a culture of data use • Establish and leverage leadership support of a data-driven culture • Adopt continuous improvement model that tracks key indicators • Design and implement a data governance strategy to ensure data quality
Challenges of district/state data connection • Cultural: Misalignment between data requested by the state and data used by the district to improve student achievement • Technical: State to District Data Transfer Barriers
DQC State/District Efforts • Advocate for state/district collaboration on data systems – HUGE opportunity around ARRA and I-3 (Investing in Innovation) funds. • Working on providing a clearinghouse on district data use through our website. • Charlotte/Mecklenburg SD • Houston, TX ISD • Provide model on state/district relationship to maximize resource capacity for scalability and sustainability • Advocate for common data standards to maximize interoperability between district/state/federal systems.
Questions? Baron Rodriguez (202) 295-7868 Baron@DataQualityCampaign.org www.DataQualityCampaign.org
American Productivity & Quality Center (APQC) Jack Grayson Chairman APQC
APQC:American Productivity & Quality Center • Founded 1977 - $10 million from 100 Orgs. • Staff: 80 • Budget $12 million • Business, Healthcare, Government, Education • Baldrige, KM, Benchmarking, CoPs, Metrics • 25-Member Education Advisory Council • In 54 countries, 6 continents • Mission: Improve productivity and quality www.apqc.org
Benchmarking • Trained over 10,000 in benchmarking and Knowledge Management (KM) in 36 countries • 4,500 Benchmarking & KM Research Studies • Benchmarking in K-12 Education: • English Language Learners • Recruiting, Selecting, Hiring Employees • Managing Information Technology • Professional Learning Communities • Math & Science Student Achievement • Response to Intervention (underway) • Data Driven Decision Making
Fulton County SchoolsData-Driven Journey Martha Greenway Deputy Superintendent December 1, 2009Greenwaym@fulton.k12.ga.us
Adopted the Balanced Scorecard in 2000, but then… Complexity Increases 71 Schools…………99 schools, 6 charters 67,000 Students……90,000 students 32% poverty……….40% poverty 8500 Staff…………12,000 staff “Wish list” budget surplus……..$62.5 million cut (so far…) $1.134 billion budget
In spite of all this…. • 86% 1st time passing HS exit exam .. from 77% • 83.7% graduation rate .. from 72.9% • 1061* SAT reading and math .. from 1027 (*75% SAT participation vs. 1016 in nation with 46% participation) • 37% enrollment in AP courses vs. 11% (while maintaining 75% passing rate)
Value Statements Each Fulton County school will educate every student to his/her fullest potential. Fulton County will engage parents as key partnersin the educational process. Each Fulton County school will be the preferred schoolfor its students and parents. Each Fulton County school will providegreater valuefor each child’s educational experiencewhen compared to top-performing public and private schools in the nation. Fulton County schools will prepare each studenttoexcelin a rapidly changingglobalsociety.
Continuous Improvement • Refined Student Achievement Measures • Value-added measures • Black achievement gap
Continuous Improvement • Teacher – level analytic tools
Continuous Improvement • Align Instructional Strategies and Professional Development
VALUE-ADDED PROFESSIONAL LEARNING MODULES PROFESSIONAL LEARNING COMMUNITIES, TECHNOLOGY & PERFORMANCE EVALUATION MANAGEMENT INTEGRATED THROUGHOUT THE MODULES
Continuous Improvement • Define and Measure Enterprise Processes
Enterprise Process Model mission value statements vision Core Processes beliefs Develop Curriculum Deliver Instruction Assess Student Learning Supporting/Enabling Processes Federal, state, and local rules and regulations Accrediting Agencies Manage Financial Resources Effectively Integrate Technology Support Student Learning Engage Stakeholders Ensure a Safe Environment Manage Human Resources Ensure Operational Efficiency Board of Education policies Research and Best Practices Guiding Processes
Fulton County School System Strategy Map Students Master Curriculum Students are Nationally Competitive Ensure Student Achievement Develop, Deliver and Assess Teaching and Learning Effectively Integrate Technology Process Improvement Themes Support Student Learning Ensure a Safe Environment Ensure Operational Efficiency Engage Stakeholders Manage Human Resources Manage Financial Resources
Continuous Improvement • Aligned school and central department measures • Process improvement training • Cross-functional action teams for process improvement (XFATs) • Enterprise Business System • Learning Management System • Enhanced Student Information System • Enterprise Information Model • Business Intelligence tools • Web Portal
Future enhancements • Implement more sophisticated business intelligence tools • Expand analytic skills of staff • Deepen leadership understanding • Align individual performance management • Expand best practice sharing • Establish centralized initiative and project management • Expand risk identification • Remain strategy focused through challenging financial times
Question & Answer Session Questions and Answers
Question #1 "Not everything that can be measured matters, and not everything that matters can be measured." How do we insure that we're engaging in authentic data-informed decision making and not merely creating more meaningless metrics around student achievement?
Question #2 Some educators are apprehensive about the use of data, either because they do not have experience with it or because they anticipate its being used as “gotcha.” What strategies are most successful in encouraging these educators to see the benefits of using data to inform instructional improvement?
Question #3 Teachers need time to review, discuss and analyze data. How do you create this time for teachers without negatively impacting instructional time?
Question #4 What guidance can you give urban school administrators on what data we need to collect that will better inform us holistically on a student's learning needs in order to help guide us in developing instruction to get more sustainable results for our children?
Question #5 How do we get students to buy into the process?
Question #6 What is the time required and what training is required for classroom teachers to use data to improve instruction?
Question #7 How do you see struggling school districts paying for data collection?