Download
1 / 15
150 likes | 304 Views
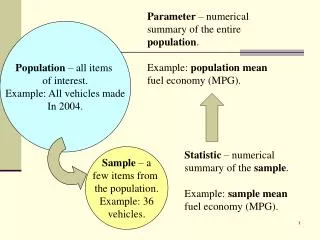
Bio-Statistic KUEU 3146 & KBEB 3153 Bio-Statistic. Estimation: Binomial, Poisson, Normal & Student’s t Distribution. Binomial Distribution. Two outcomes i.e Yes/No, Head/Tail, Live/Die, success/fail etc Independent event Defined by 2 parameters: n,p Mean, μ =np

E N D
Bio-Statistic KUEU 3146 & KBEB 3153Bio-Statistic Estimation: Binomial, Poisson, Normal & Student’s t Distribution
Binomial Distribution • Two outcomes i.e Yes/No, Head/Tail, Live/Die, success/fail etc • Independent event • Defined by 2 parameters: n,p • Mean, μ=np • Standard deviation σ=√(np(1-p)). • Binomial Probability ( ) n P(X=x)= px(1-p)n-x x
Binomial Distribution • According to the Vital Statistics of United States, there is roughly 80% chance that a person aged 20 will be alive at age 65. Suppose that three people aged at 20 are selected at random. Find the probability that the number alive at age 65 will be • Exacly two person alive. (Ans: P=0.384) • At least one person alive. (Ans: P=0.104) • At most one person alive. (Ans: P=0.992)
Poisson Distribution • Defined by a parameters: λ • Mean, μ=λ • Standard deviation σ=√ λ. • Binomial Probability Where e = 2.718 and λ is a positive real number λx e-λ P(X=x)= x!
Poisson Distribution • Some reports indicate that the number of patients arriving at the hospital between 6.00pm and 7.00pm has a poisson distribution with a parameter λ = 6.9. Determine the probability that, on a given day the number of patients who arrive at the hospital between 6.00pm and 7.00 pm will be • Exacly two patients. (Ans: P=0.095) • Between 4 and 10 patients. (Ans: P=0.821) • At most two patients. (Ans: P=0.032)
Poisson Approximation to Binomial • Determine n (the number of trails) and p (the success probability) • Determine whether n ≥ 100 and np ≤ 10. If they are not, do not use the poisson approximation. • Use binomial Probability Where e = 2.718 and λ is a positive real number (np)x e-np P(X=x)= x!
Poisson Approximation to Binomial • Statistical Abstract of the United State reported that the infant mortality rate (IMR) in Sweden is 3.5 per 1000 live birth. Estimate the probability that 500 randomly selected live birth, there are • No infant deaths. (Ans: P=0.174) • At most three infant deaths. (Ans: P=0.899)
Normal Distribution(Gaussian Distribution) Properties of Normal Distribution • It has symmetrical bell-shape curve. • Defined by 2 parameters: mean (μ) and standard deviation (σ). • Has a particular internal distribution for the area under curve. Example, 68.26% of the area is contained within μ±1σ, 95.45% within μ±2σ and 99.74% within μ±3σ.
Normal Distribution(Gaussian Distribution) Properties of Normal Distribution • It has symmetrical bell-shape curve. • Defined by 2 parameters: mean (μ) and standard deviation (σ). • Has a particular internal distribution for the area under curve. Example, 68.26% of the area is contained within μ±1σ, 95.45% within μ±2σ and 99.74% within μ±3σ.
Normal Distriburion CurveSymmetrical Frequency Distribution 99.74% 95.45% 68.26% μ-3σ μ-2σ μ-1σ μ μ+1σ μ+2σ μ+3σ
Area Under Normal Curve x - μ Z = 34.13% σ 13.13% 2.15% -3 -2 -1 0 1 2 3
Area Under Normal CurveZ Score x - μ Z = σ 0.4332 0.5 -3 -2 -1 0 1 1.5 2 3 What is the proportion of students having SAT Maths score between 500 and 650? Mean SAT Maths score is 500 with standard deviation of 100.
Area Under Normal CurveZ Score x - μ Z = σ 0.3849 + 0.4332 = 0.8181 0.4332 0.3849 -3 -2 -1.2 -1 0 1 1.5 2 3 What is the proportion of students having SAT Maths score between 380 and 650? Mean SAT Maths score is 500 with standard deviation of 100.
Area Under Normal CurveZ Score Determine the Z score having an area of 0.025 and 0.04 under the standard normal curve as shown below. 0.05 0.025 Z = ? Z = ? 0
Student’s t Distribution Distribution of sample means x - μ t = df = n - 1 s/√n x - μ Z score formula for population distribution is different from this one z = σ/√n