Download
1 / 27
270 likes | 788 Views
The Spatial Scan Statistic. Null Hypothesis. The risk of disease is the same in all parts of the map. . One-Dimensional Scan Statistic. The Spatial Scan Statistic. Create a regular or irregular grid of centroids covering the whole study region.

E N D
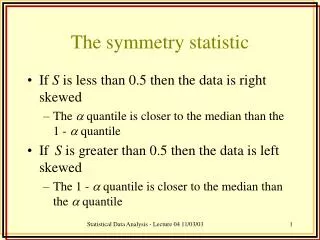
Null Hypothesis The risk of disease is the same in all parts of the map.
The Spatial Scan Statistic • Create a regular or irregular grid of centroids covering the whole study region. • Create an infinite number of circles around each centroid, with the radius anywhere from zero up to a maximum so that at most 50 percent of the population is included.
Collection of overlapping circles of different sizes.
For each circle: • Obtain actual and expected number of cases inside and outside the circle. • Calculate Likelihood Function. • Compare Circles: • Pick circle with highest likelihood function as Most Likely Cluster. • Inference: • Generate random replicas of the data set under the null-hypothesis of no clusters (Monte Carlo sampling). • Compare most likely clusters in real and random data sets (Likelihood ratio test).
Spatial Scan Statistic: Properties • Adjusts for inhomogeneous population density. • Simultaneously tests for clusters of any size and any location, by using circular windows with continuously variable radius. • Accounts for multiple testing. • Possibility to include confounding variables, such as age, sex or socio-economic variables. • Aggregated or non-aggregated data (states, counties, census tracts, block groups, households, individuals).
Breast Cancer Incidence, Relative Risks Age-Adjusted, Indirect Standardization
Four Most Likely Clusters p=0.99 p=0.11 p=0.37 p=0.88
Four Most Likely Clusters Cluster Obs Exp RR p= East 1853 1722 1.08 0.11 Central 986 899 1.10 0.37 Southwest 51 36 1.43 0.89 Northwest 199 172 1.16 0.99
Geographical Aggregation • In traditional mapping of rates or relative risks for disjoint geographical areas, there is a trade-off between the stability of the estimates and the geographical resolution. • With tests for spatial randomness, less geographical data aggregation is always better: • Ability to detect clusters not conforming to political boundaries. • More accurate data / less loss of information.
Breast Cancer IncidenceCensus Tract Analysis 732 census tracts
Eight Most Likely Clusters for Breast Cancer Incidence (approximate locations)
Iowa Breast Cancer Incidence Census Tract Aggregation Cluster Obs Exp RR LLR p= 1 341 240 1.4 19.4 0.001 2 28 11 2.6 9.8 0.03 3 1843 1708 1.1 6.7 0.39 4 29 15 2.0 5.3 0.80 5 21 10 2.1 4.4 0.98 6 30 17 1.8 4.4 0.98 7 208 171 1.2 3.8 0.99 8 41 26 1.6 3.8 0.99
Iowa Breast Cancer Staging Census Tract Aggregation Late Stage Cases: 758 Total Cases: 7415
Six Most Likely Clusters of Late Stage Breast Cancer B C A F E D
Late Stage Breast Cancer Census Tract Aggregation Cluster Obs Exp RR LLR p = A 15 4.5 3.3 9.2 0.049 B 13 4.7 2.8 5.9 0.62 C 6 1.3 4.5 5.5 0.75 D 44 27.1 1.6 5.3 0.81 E 9 3.1 2.9 4.5 0.97 F 4 0.9 3.5 4.3 0.99
Summary: Breast Cancer in Iowa • A cluster of high breast cancer incidence was found west of Des Moines. • The geographical distribution of late stage breast cancer is rather even, with only one marginally significant cluster
Summary: Spatial Scan Statistic • Cluster detection irrespectively of political boundaries, and without assumptions about cluster size or location. • Adjusts for multiple testing. • It is only possible to pinpoint the general location of a cluster. The borders are approximate. • It is a surveillance tool. The cause of a cluster must be investigated through other means.
Two Complimentary Maps A map with smoothed disease rates provides a rate estimate for all parts of the map, but it does not tell us whether the pattern is random or not. A map based on the spatial scan statistic tells us if and where there are areas with a significantly higher disease rate, but it does not provide a rate estimate for all parts of the map.
Breast Cancer MortalityNortheastern United States States: Maine, N.H., Vermont, Mass., R.I., Connecticut, N.Y., N.J., Pennsylvania, Delaware, Maryland, D.C. Years: 1988-1992 Deaths: 58,943 Population: 29,535,210 Geographical Aggregation: 245 counties Joint work with: E Feuer, B Miller, L Freedman, NCI
Breast cancer mortality Most likely cluster p=0.001
Most Likely Clusters Location Obs Exp RR LLR p NY/Philadelphia 24,044 23,040 1.074 35.7 0.001 Buffalo 1,416 1,280 1.109 7.1 0.12 Washington DC 712 618 1.154 6.9 0.15 Boston 5,966 5,726 1.047 5.5 0.40 Eastern Maine 267 229 1.166 3.0 0.99
References General Theory Kulldorff M. A Spatial Scan Statistic, Communications in Statistics, Theory and Methods, 26:1481-1496, 1997. Application Kulldorff M. Feuer E, Miller B, Freedman L. Breast Cancer in Northeast United States: A Geographic Analysis. American Journal of Epidemiology, 146:161-170, 1997.