Download
1 / 6
80 likes | 189 Views
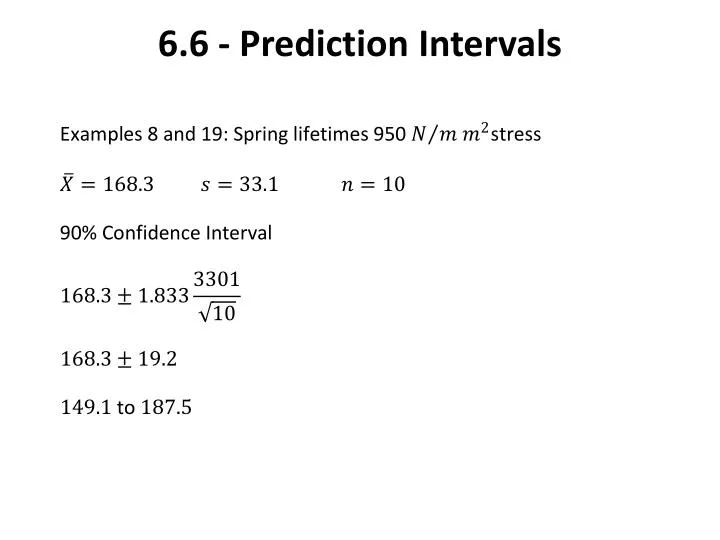
6.6 - Prediction Intervals. 90% confidence interval for is 149.1 to 187.5. We are 90% confident that the overall (population) average lifetime is between 149.1 and 187.5

E N D
90% confidence interval for is 149.1 to 187.5. We are 90% confident that the overall (population) average lifetime is between 149.1 and 187.5 • For the next spring for what interval of lifetimes are we 90% confident that this spring’s lifetime will fall in this interval? This is a prediction interval. • The prediction interval will be wider than the confidence interval. Even if we knew exactly, (zero width confidence interval) variability from spring to spring would make the nextspring’slifetime not exactly equal to.
Our ability to predict the next spring’s lifetime depends on 2 things: • How well we have estimated and • How variable individual springs are
Tolerance Interval: I want to specify an interval of lifetimes such that I am 95% confident that 99% of the springs’ lifetimes fall in this interval. Or we could find a one-sided tolerance interval (a guarantee) such that I am 95% confident that 99% of the springs meet the guarantee. • There are tables to find these intervals, but we won’t be finding tolerance intervals.